67 13th St Lowell, MA 01850
Centralville NeighborhoodEstimated Value: $471,000 - $506,000
About This Home
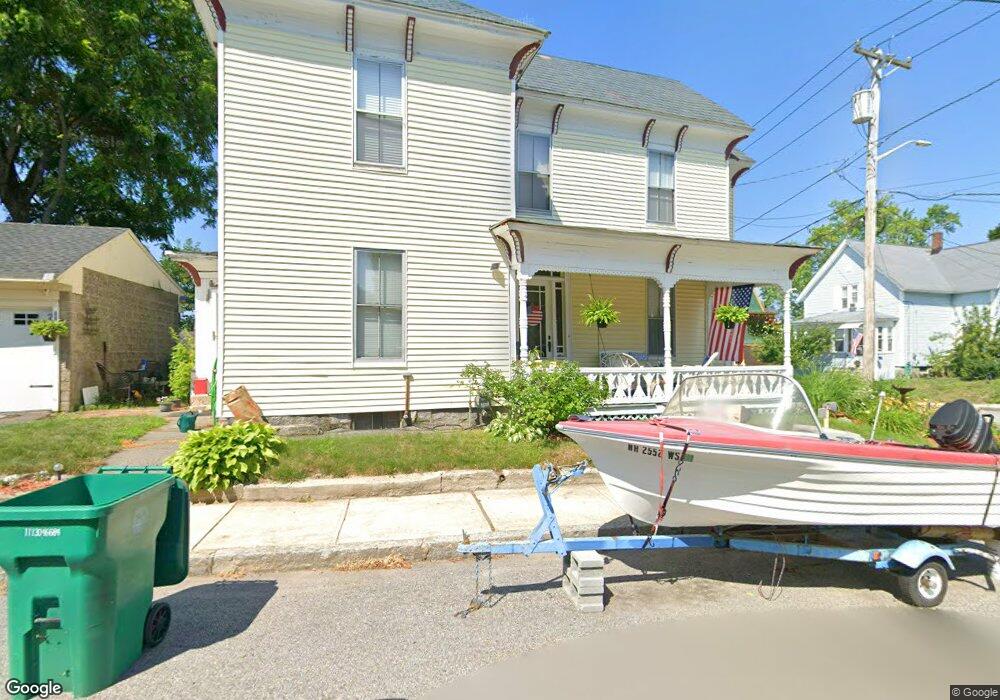
This home is located at 67 13th St, Lowell, MA 01850 and is currently estimated at $485,617, approximately $220 per square foot. 67 13th St is a home located in Middlesex County with nearby schools including S. Christa McAuliffe Elementary School, Greenhalge Elementary School, and Moody Elementary School.
Ownership History
We collect this data history from publicly available records. To have your information removed, we recommend requesting removal directly through your county’s website.
Purchase Details
Home Financials for this Owner
Home Financials are based on the most recent Mortgage that was taken out on this home.Purchase Details
Home Values in the Area
Average Home Value in this Area
Purchase History
We collect this data history from publicly available records. To have your information removed, we recommend requesting removal directly through your county’s website.
| Date | Buyer | Sale Price | Title Company |
|---|---|---|---|
| $114,000 | -- | ||
| $114,000 | -- | ||
| $74,000 | -- | ||
| $74,000 | -- |
Mortgage History
We collect this data history from publicly available records. To have your information removed, we recommend requesting removal directly through your county’s website.
| Date | Status | Borrower | Loan Amount |
|---|---|---|---|
| Open | $116,280 | ||
| Closed | $116,280 | ||
| Previous Owner | $57,300 |
Tax History
We collect this data history from publicly available records. To have your information removed, we recommend requesting removal directly through your county’s website.
| Year | Tax Paid | Tax Assessment Tax Assessment Total Assessment is a certain percentage of the fair market value that is determined by local assessors to be the total taxable value of land and additions on the property. | Land | Improvement |
|---|---|---|---|---|
| 2025 | $4,796 | $417,800 | $122,800 | $295,000 |
| 2024 | $4,679 | $392,900 | $114,800 | $278,100 |
| 2023 | $4,420 | $355,900 | $99,800 | $256,100 |
| 2022 | $4,172 | $328,800 | $90,800 | $238,000 |
| 2021 | $3,897 | $289,500 | $78,900 | $210,600 |
| 2020 | $3,594 | $269,000 | $68,900 | $200,100 |
| 2019 | $3,408 | $242,700 | $63,800 | $178,900 |
| 2018 | $3,333 | $231,600 | $60,800 | $170,800 |
| 2017 | $3,197 | $214,300 | $55,300 | $159,000 |
| 2016 | $3,026 | $199,600 | $53,900 | $145,700 |
| 2015 | $2,924 | $188,900 | $53,900 | $135,000 |
| 2013 | $2,727 | $181,700 | $63,000 | $118,700 |
Map
- 23 18th St
- 51 Willard St
- 337 Beacon St
- 54 Hampshire St
- 192 Hildreth St
- 185 18th St
- 18 Sutherland St
- 367 Aiken Ave Unit 8
- 89 Bunker Hill Ave
- 69 Lilley Ave
- 365 Aiken Ave Unit 11
- 191 W 6th St
- 96 Fremont St
- 246 Aiken Ave Unit 7
- 63-65 Sixth St
- 45 W 4th St
- 11 Lilley Ave
- Lot 11 Christian St
- Lot 12 Christian St
- Lot 9 Christian St
Ask me questions while you tour the home.