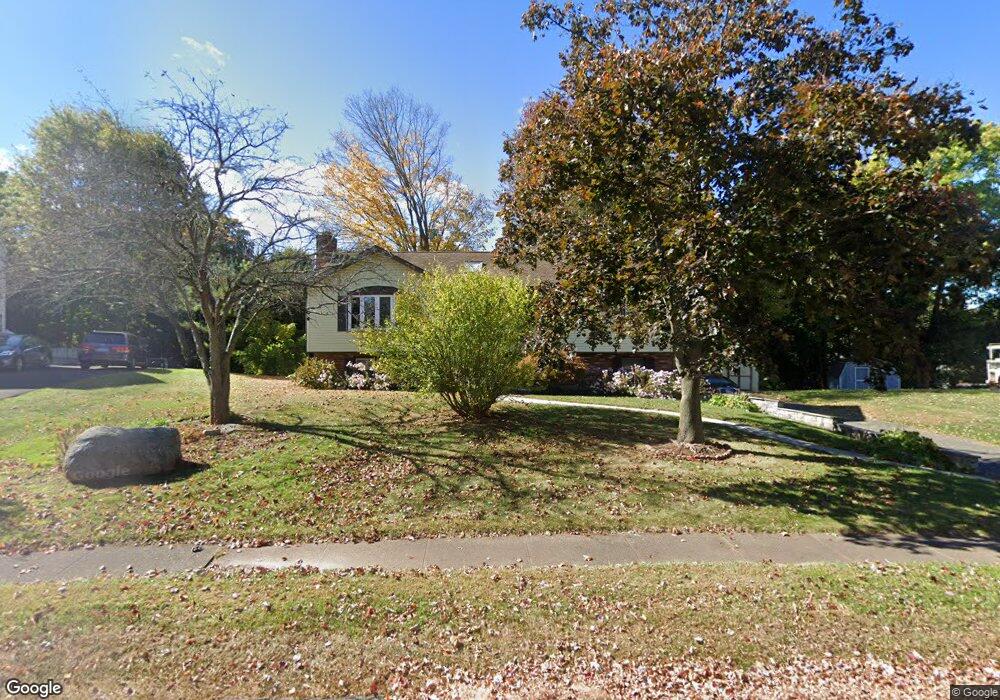
67 Bishop Ave Southington, CT 06489
West Southington NeighborhoodEstimated Value: $415,000 - $428,000
3
Beds
2
Baths
1,236
Sq Ft
$340/Sq Ft
Est. Value
About This Home
This home is located at 67 Bishop Ave, Southington, CT 06489 and is currently estimated at $420,675, approximately $340 per square foot. 67 Bishop Ave is a home located in Hartford County with nearby schools including Urbin T. Kelley Elementary School, Joseph A. Depaolo Middle School, and Southington High School.
Ownership History
Date
Name
Owned For
Owner Type
Purchase Details
Closed on
Aug 3, 2022
Sold by
Smith Joseph
Bought by
Smith Yolanta
Current Estimated Value
Purchase Details
Closed on
Jun 25, 1993
Sold by
Salvatore David and Salvatore Sheryl
Bought by
Sagan Yolanta and Sagan Maria
Create a Home Valuation Report for This Property
The Home Valuation Report is an in-depth analysis detailing your home's value as well as a comparison with similar homes in the area
Home Values in the Area
Average Home Value in this Area
Purchase History
| Date | Buyer | Sale Price | Title Company |
|---|---|---|---|
| Smith Yolanta | -- | None Available | |
| Sagan Yolanta | $155,000 | -- |
Source: Public Records
Mortgage History
| Date | Status | Borrower | Loan Amount |
|---|---|---|---|
| Previous Owner | Sagan Yolanta | $34,690 | |
| Previous Owner | Sagan Yolanta | $245,600 | |
| Previous Owner | Sagan Yolanta | $113,000 |
Source: Public Records
Tax History
| Year | Tax Paid | Tax Assessment Tax Assessment Total Assessment is a certain percentage of the fair market value that is determined by local assessors to be the total taxable value of land and additions on the property. | Land | Improvement |
|---|---|---|---|---|
| 2025 | $6,659 | $200,520 | $61,660 | $138,860 |
| 2024 | $6,304 | $200,520 | $61,660 | $138,860 |
| 2023 | $6,088 | $200,520 | $61,660 | $138,860 |
| 2022 | $5,841 | $200,520 | $61,660 | $138,860 |
| 2021 | $5,821 | $200,520 | $61,660 | $138,860 |
| 2020 | $5,163 | $168,560 | $56,300 | $112,260 |
| 2019 | $5,165 | $168,560 | $56,300 | $112,260 |
| 2018 | $5,138 | $168,560 | $56,300 | $112,260 |
| 2017 | $5,138 | $168,560 | $56,300 | $112,260 |
| 2016 | $4,996 | $168,560 | $56,300 | $112,260 |
| 2015 | $4,981 | $170,940 | $53,620 | $117,320 |
| 2014 | $4,848 | $170,940 | $53,620 | $117,320 |
Source: Public Records
Map
Nearby Homes
- 119 Bishop Ave
- 46 John St
- 185 West St Unit 4
- 77 Howard Ave
- 82 Summer St Unit A
- 82 Summer St Unit B
- 86 Bristol St
- 73 Jubilee Dr
- 94 Huckleberry Ln
- 142 Liberty St
- 24 Vicki Ln
- 88 October Ln
- 49 Mark Dr
- 87 Carter Ln
- 309 Russet Ln
- 141 Little Fawn Rd
- 245 Wonx Spring Rd
- 83 Little Fawn Rd
- 349 Marion Ave Unit 18
- 349 Marion Ave Unit 12
Your Personal Tour Guide
Ask me questions while you tour the home.