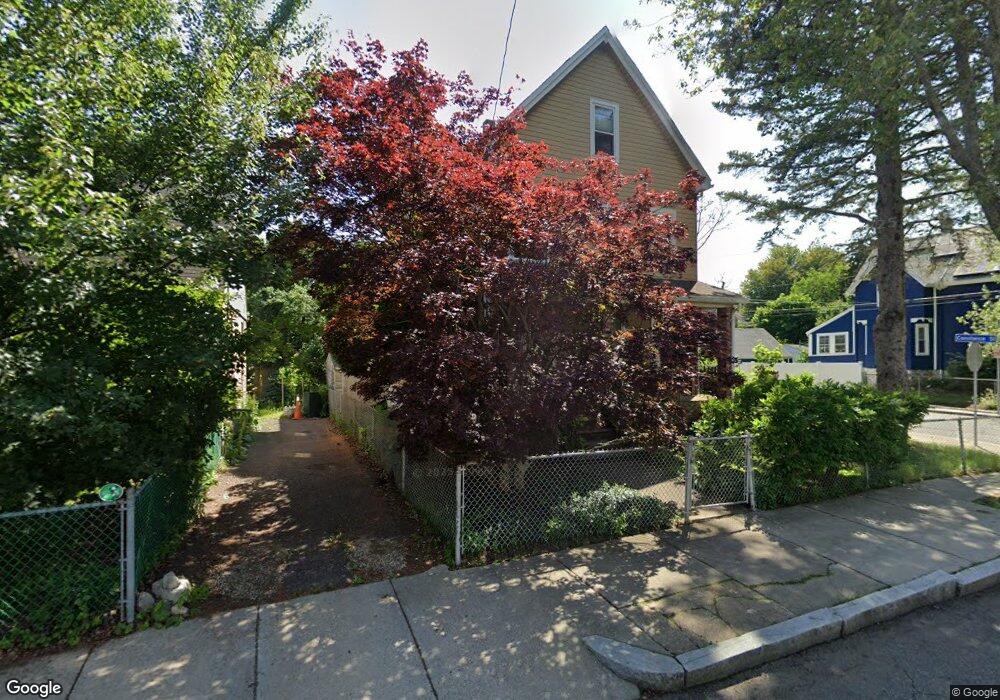
67 Bowman St Malden, MA 02148
Maplewood NeighborhoodEstimated Value: $905,169 - $963,000
About This Home
This home is located at 67 Bowman St, Malden, MA 02148 and is currently estimated at $944,292, approximately $405 per square foot. 67 Bowman St is a home located in Middlesex County with nearby schools including Malden High School, Cheverus Centennial School, and Malden Catholic.
Ownership History
We collect this data history from publicly available records. To have your information removed, we recommend requesting removal directly through your county’s website.
Purchase Details
Purchase Details
Purchase Details
Home Values in the Area
Average Home Value in this Area
Purchase History
We collect this data history from publicly available records. To have your information removed, we recommend requesting removal directly through your county’s website.
| Date | Buyer | Sale Price | Title Company |
|---|---|---|---|
| -- | None Available | ||
| -- | -- | ||
| $195,000 | -- |
Tax History
We collect this data history from publicly available records. To have your information removed, we recommend requesting removal directly through your county’s website.
| Year | Tax Paid | Tax Assessment Tax Assessment Total Assessment is a certain percentage of the fair market value that is determined by local assessors to be the total taxable value of land and additions on the property. | Land | Improvement |
|---|---|---|---|---|
| 2025 | $86 | $763,500 | $286,200 | $477,300 |
| 2024 | $8,397 | $718,300 | $269,400 | $448,900 |
| 2023 | $8,109 | $665,200 | $244,200 | $421,000 |
| 2022 | $7,785 | $630,400 | $223,100 | $407,300 |
| 2021 | $7,593 | $617,800 | $210,500 | $407,300 |
| 2020 | $7,227 | $571,300 | $194,500 | $376,800 |
| 2019 | $6,895 | $519,600 | $185,200 | $334,400 |
| 2018 | $6,612 | $469,300 | $153,600 | $315,700 |
| 2017 | $6,437 | $454,300 | $153,600 | $300,700 |
| 2016 | $6,075 | $400,700 | $141,000 | $259,700 |
| 2015 | $5,878 | $373,700 | $134,300 | $239,400 |
| 2014 | $5,471 | $339,800 | $122,100 | $217,700 |
Map
- 29 Bowman St
- 45-47 Durso Ave
- 28 Olive Ave
- 14 Dodge St
- 41 Webber St Unit 1
- 0 Beachview Ave
- 292 Broadway
- 40-42 Swan St
- 42 Jennifer Ln
- 118 Elwell St
- 130 Elwell St
- 241 Lebanon St
- 32 Myrtle St
- 123-125 Laurel St
- 101 Waite St Unit C5
- 131 Laurel St Unit C
- 44 Loomis St Unit 308A
- 44 Loomis St Unit 103
- 71 Williams St
- 70 Crescent Ln
Ask me questions while you tour the home.