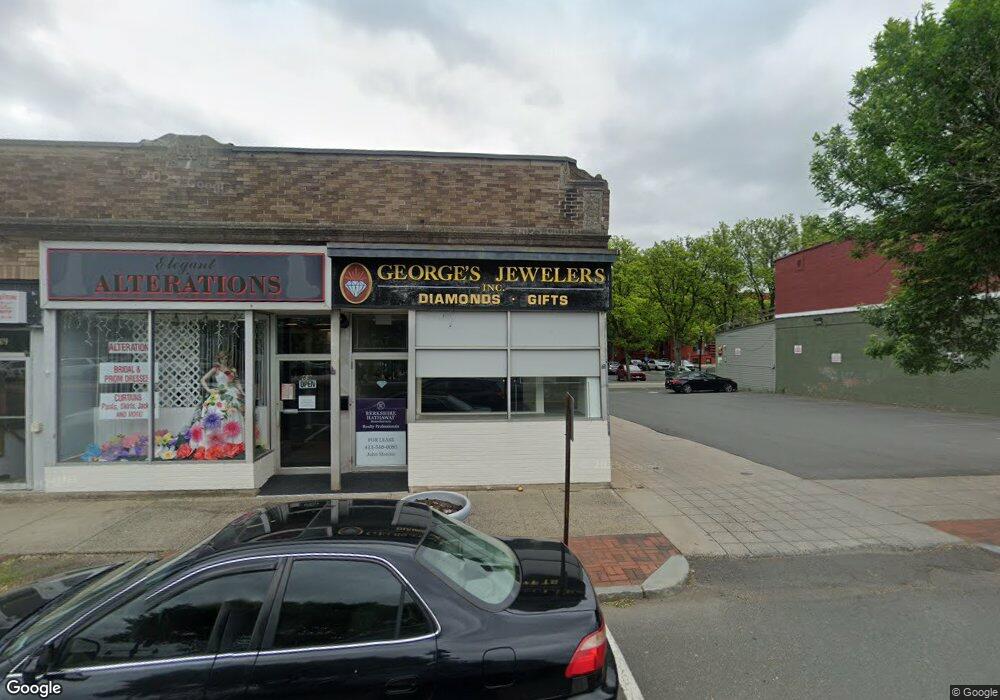
67 Elm St Westfield, MA 01085
Estimated Value: $359,228
3
Beds
2
Baths
3,150
Sq Ft
$114/Sq Ft
Est. Value
About This Home
This home is located at 67 Elm St, Westfield, MA 01085 and is currently estimated at $359,228, approximately $114 per square foot. 67 Elm St is a home located in Hampden County with nearby schools including Westfield High School and Saint Mary High School.
Ownership History
Date
Name
Owned For
Owner Type
Purchase Details
Closed on
Nov 17, 2023
Sold by
Woodson Anne K
Bought by
Morizio Brothers Mgmt Llc
Current Estimated Value
Home Financials for this Owner
Home Financials are based on the most recent Mortgage that was taken out on this home.
Original Mortgage
$300,000
Outstanding Balance
$294,757
Interest Rate
7.49%
Mortgage Type
Commercial
Estimated Equity
$64,471
Purchase Details
Closed on
Apr 11, 2005
Sold by
Kedzierski Bernice and Kedzierski George J
Bought by
Woodson Anne K
Home Financials for this Owner
Home Financials are based on the most recent Mortgage that was taken out on this home.
Original Mortgage
$120,000
Interest Rate
5.7%
Mortgage Type
Commercial
Create a Home Valuation Report for This Property
The Home Valuation Report is an in-depth analysis detailing your home's value as well as a comparison with similar homes in the area
Home Values in the Area
Average Home Value in this Area
Purchase History
| Date | Buyer | Sale Price | Title Company |
|---|---|---|---|
| Morizio Brothers Mgmt Llc | $315,000 | None Available | |
| Woodson Anne K | $120,000 | -- |
Source: Public Records
Mortgage History
| Date | Status | Borrower | Loan Amount |
|---|---|---|---|
| Open | Morizio Brothers Mgmt Llc | $300,000 | |
| Previous Owner | Woodson Anne K | $120,000 |
Source: Public Records
Tax History
| Year | Tax Paid | Tax Assessment Tax Assessment Total Assessment is a certain percentage of the fair market value that is determined by local assessors to be the total taxable value of land and additions on the property. | Land | Improvement |
|---|---|---|---|---|
| 2025 | $6,732 | $230,800 | $41,300 | $189,500 |
| 2024 | $4,256 | $135,600 | $37,500 | $98,100 |
| 2023 | $4,107 | $121,300 | $35,700 | $85,600 |
| 2022 | $4,070 | $112,100 | $31,800 | $80,300 |
| 2021 | $6,037 | $112,100 | $31,800 | $80,300 |
| 2020 | $4,160 | $112,100 | $31,800 | $80,300 |
| 2019 | $4,063 | $107,100 | $30,300 | $76,800 |
| 2018 | $6,020 | $105,300 | $30,300 | $75,000 |
| 2017 | $5,799 | $101,700 | $30,300 | $71,400 |
| 2016 | $3,730 | $101,700 | $30,300 | $71,400 |
| 2015 | $3,403 | $98,100 | $30,300 | $67,800 |
| 2014 | $2,548 | $98,100 | $30,300 | $67,800 |
Source: Public Records
Map
Nearby Homes
- 205 Elm St
- 13 Green Ave
- 13 Hampden St
- 25 King St
- 97 Mechanic St
- 100 Meadow St
- 19 Kellogg St
- 145 Main St
- 32 Allen Ave
- 114 Otis St Unit C
- 9 Montgomery St
- 16 Squawfield Rd
- 17 Toledo Ave
- 70 S Maple St
- 88 Woodmont St
- 82 S Maple St Unit 38E
- 82 S Maple St Unit 31
- 85 Granville Rd
- 180 Russell Rd
- 0 Lockhouse Rd Unit 73496193
Your Personal Tour Guide
Ask me questions while you tour the home.