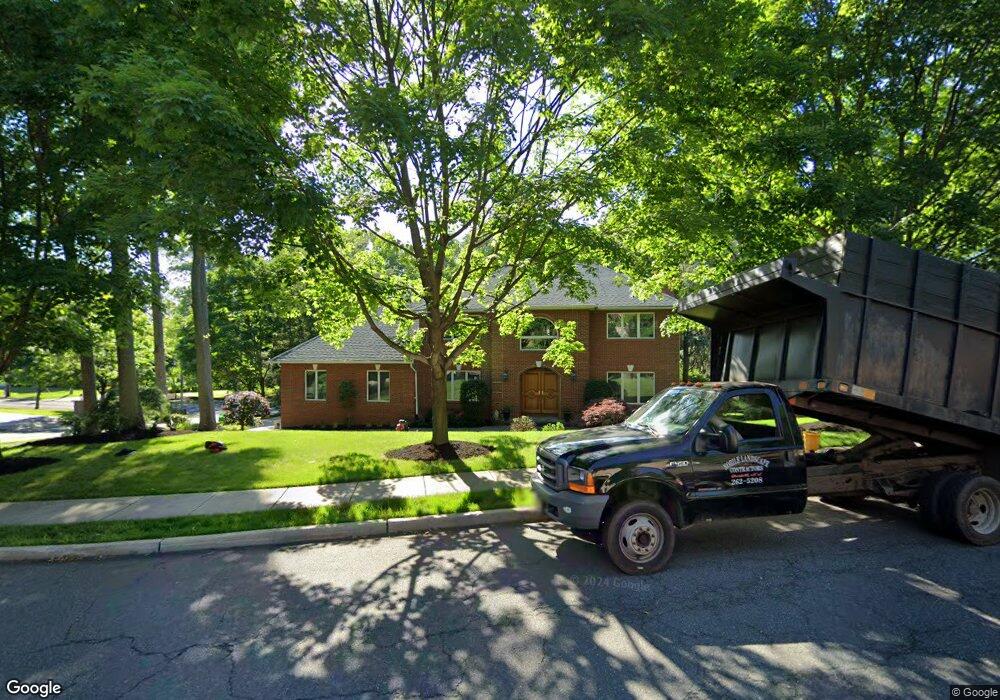
67 Lilac Ln Paramus, NJ 07652
Estimated Value: $1,230,000 - $1,871,000
Studio
--
Bath
2,942
Sq Ft
$509/Sq Ft
Est. Value
About This Home
This home is located at 67 Lilac Ln, Paramus, NJ 07652 and is currently estimated at $1,496,699, approximately $508 per square foot. 67 Lilac Ln is a home located in Bergen County with nearby schools including Paramus High School, Ben Porat Yosef, and St. Peter Academy.
Ownership History
Date
Name
Owned For
Owner Type
Purchase Details
Closed on
Sep 21, 2000
Bought by
Zotta Rodolfo
Current Estimated Value
Home Financials for this Owner
Home Financials are based on the most recent Mortgage that was taken out on this home.
Original Mortgage
$179,000
Interest Rate
7.81%
Purchase Details
Closed on
Jan 27, 1998
Sold by
Howland Forest Inc
Bought by
Zotta Rodolfo and Zotta Ana
Home Financials for this Owner
Home Financials are based on the most recent Mortgage that was taken out on this home.
Original Mortgage
$340,000
Interest Rate
6.95%
Create a Home Valuation Report for This Property
The Home Valuation Report is an in-depth analysis detailing your home's value as well as a comparison with similar homes in the area
Home Values in the Area
Average Home Value in this Area
Purchase History
| Date | Buyer | Sale Price | Title Company |
|---|---|---|---|
| Zotta Rodolfo | -- | -- | |
| Zotta Rodolfo | -- | -- | |
| Zotta Rodolfo | $463,000 | -- |
Source: Public Records
Mortgage History
| Date | Status | Borrower | Loan Amount |
|---|---|---|---|
| Previous Owner | Zotta Rodolfo | $179,000 | |
| Previous Owner | Zotta Rodolfo | $340,000 |
Source: Public Records
Tax History
| Year | Tax Paid | Tax Assessment Tax Assessment Total Assessment is a certain percentage of the fair market value that is determined by local assessors to be the total taxable value of land and additions on the property. | Land | Improvement |
|---|---|---|---|---|
| 2025 | $17,596 | $1,213,200 | $418,600 | $794,600 |
| 2024 | $17,121 | $1,162,200 | $387,300 | $774,900 |
| 2023 | $16,259 | $1,116,100 | $369,000 | $747,100 |
| 2022 | $16,259 | $1,047,600 | $344,300 | $703,300 |
| 2021 | $15,963 | $965,100 | $318,000 | $647,100 |
| 2020 | $15,172 | $951,200 | $313,000 | $638,200 |
| 2019 | $15,312 | $825,000 | $366,300 | $458,700 |
| 2018 | $15,122 | $825,000 | $366,300 | $458,700 |
| 2017 | $14,858 | $825,000 | $366,300 | $458,700 |
| 2016 | $14,454 | $825,000 | $366,300 | $458,700 |
| 2015 | $14,306 | $825,000 | $366,300 | $458,700 |
| 2014 | $14,182 | $825,000 | $366,300 | $458,700 |
Source: Public Records
Map
Nearby Homes
- 56 Lilac Ln
- 81 Eastbrook Dr
- 66 Knollwood Dr
- 46 Knollwood Dr
- 122 Village Cir E
- 127 Village Cir E
- 16 Coles Ct
- 374 Valley Rd
- 302 Howland Ave
- 175 Valley Rd
- 405 Valley Rd
- 189 Forest Ave Unit 317
- 189 Forest Ave Unit 216
- 44 Forsythia Ln
- 842 Grant Ave
- 857 Collingwood Ave
- 181 Allen St
- 761 Palmer Ave
- 457 the Fenway
- 149 Allen St
Your Personal Tour Guide
Ask me questions while you tour the home.