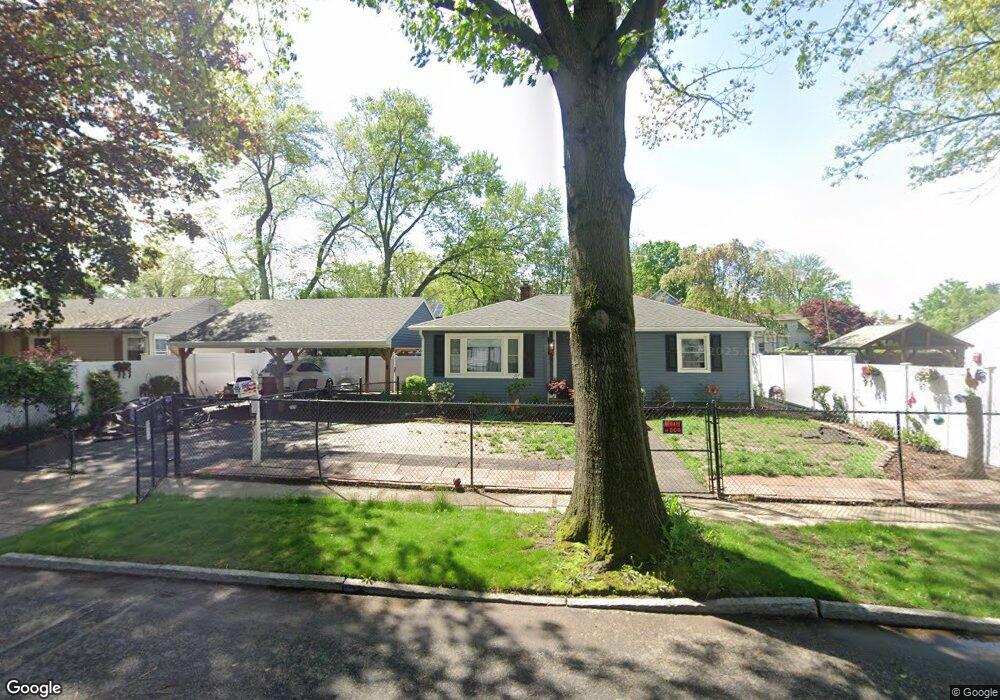
67 Rowland St Springfield, MA 01107
Brightwood NeighborhoodEstimated Value: $254,736 - $306,000
3
Beds
1
Bath
962
Sq Ft
$284/Sq Ft
Est. Value
About This Home
This home is located at 67 Rowland St, Springfield, MA 01107 and is currently estimated at $273,184, approximately $283 per square foot. 67 Rowland St is a home located in Hampden County with nearby schools including High School Of Commerce, Springfield High School of Science and Technology, and Roger L. Putnam Vocational Technical Academy.
Ownership History
Date
Name
Owned For
Owner Type
Purchase Details
Closed on
Jun 25, 2024
Sold by
Coakley-Rivera Cheryl A
Bought by
Coakley-Rivera Cheryl A and Marino Laura M
Current Estimated Value
Purchase Details
Closed on
Jun 4, 2003
Sold by
Rivera Cheryl A and Marino Laura M
Bought by
Rivera Cheryl A
Home Financials for this Owner
Home Financials are based on the most recent Mortgage that was taken out on this home.
Original Mortgage
$56,000
Interest Rate
5.83%
Mortgage Type
Purchase Money Mortgage
Purchase Details
Closed on
Jun 7, 1999
Sold by
Sheehan Mary R
Bought by
Rivera Cheryl A and Marino Laura M
Home Financials for this Owner
Home Financials are based on the most recent Mortgage that was taken out on this home.
Original Mortgage
$44,000
Interest Rate
6.85%
Mortgage Type
Purchase Money Mortgage
Create a Home Valuation Report for This Property
The Home Valuation Report is an in-depth analysis detailing your home's value as well as a comparison with similar homes in the area
Home Values in the Area
Average Home Value in this Area
Purchase History
| Date | Buyer | Sale Price | Title Company |
|---|---|---|---|
| Coakley-Rivera Cheryl A | -- | None Available | |
| Coakley-Rivera Cheryl A | -- | None Available | |
| Rivera Cheryl A | $24,000 | -- | |
| Rivera Cheryl A | $55,000 | -- | |
| Rivera Cheryl A | $24,000 | -- | |
| Rivera Cheryl A | $55,000 | -- |
Source: Public Records
Mortgage History
| Date | Status | Borrower | Loan Amount |
|---|---|---|---|
| Previous Owner | Rivera Cheryl A | $56,000 | |
| Previous Owner | Rivera Cheryl A | $44,000 |
Source: Public Records
Tax History
| Year | Tax Paid | Tax Assessment Tax Assessment Total Assessment is a certain percentage of the fair market value that is determined by local assessors to be the total taxable value of land and additions on the property. | Land | Improvement |
|---|---|---|---|---|
| 2025 | $3,062 | $195,300 | $31,900 | $163,400 |
| 2024 | $2,931 | $182,500 | $31,900 | $150,600 |
| 2023 | $2,834 | $166,200 | $29,000 | $137,200 |
| 2022 | $2,065 | $109,700 | $27,100 | $82,600 |
| 2021 | $2,000 | $105,800 | $24,600 | $81,200 |
| 2020 | $1,943 | $99,500 | $24,600 | $74,900 |
| 2019 | $1,909 | $97,000 | $24,600 | $72,400 |
| 2018 | $1,781 | $90,500 | $24,600 | $65,900 |
| 2017 | $1,767 | $89,900 | $18,500 | $71,400 |
| 2016 | $1,557 | $79,200 | $18,500 | $60,700 |
| 2015 | $1,522 | $77,400 | $18,500 | $58,900 |
Source: Public Records
Map
Nearby Homes
- 50-54 Orchard St
- 21 Merwin St
- 62 Washburn St
- 224 Riverdale St
- 28 Larone Ave
- 31 Washburn St
- 917 Elm St
- 20-22 Gay Terrace
- 49-53 Jefferson Ave
- 48-50 Elm Cir
- 334 Elm St
- 52 Osgood St
- 2 Windpath E
- 58 Field St
- 26 Hebron St
- 85 Narragansett St
- 57 Narragansett St
- 113 Lexington St
- 35-37 Narragansett St
- 78 Prospect St
Your Personal Tour Guide
Ask me questions while you tour the home.