67 Sycamore Ave Attleboro, MA 02703
Estimated Value: $441,322 - $486,000
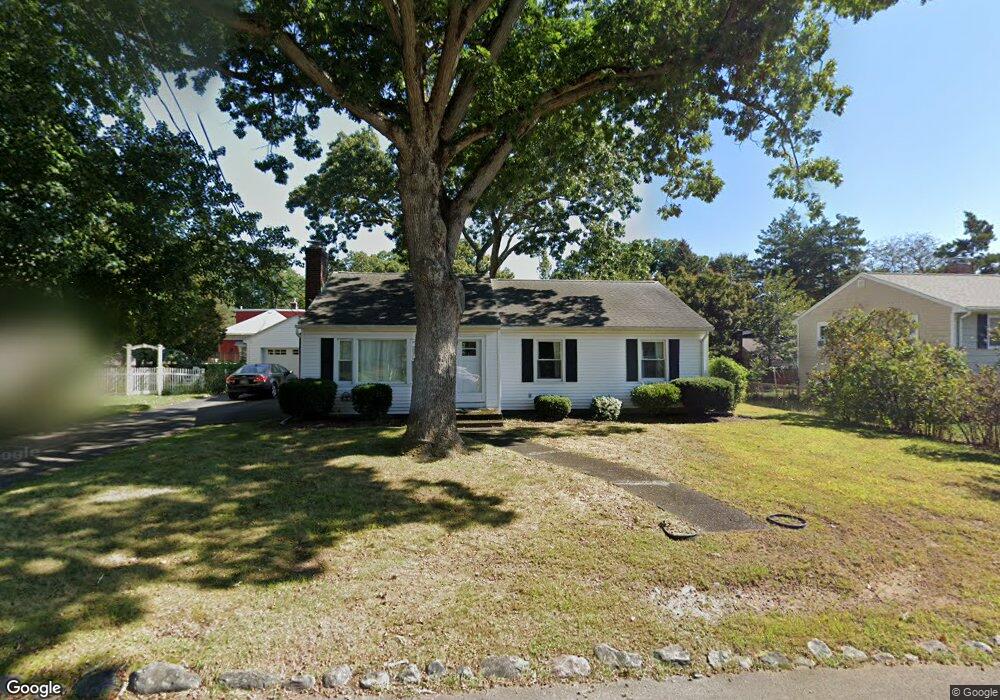
About This Home
This home is located at 67 Sycamore Ave, Attleboro, MA 02703 and is currently estimated at $465,331, approximately $361 per square foot. 67 Sycamore Ave is a home located in Bristol County with nearby schools including Hill-Roberts Elementary School, Robert J. Coelho Middle School, and Attleboro High School.
Ownership History
We collect this data history from publicly available records. To have your information removed, we recommend requesting removal directly through your county’s website.
Purchase Details
Home Financials for this Owner
Home Financials are based on the most recent Mortgage that was taken out on this home.Home Values in the Area
Average Home Value in this Area
Purchase History
We collect this data history from publicly available records. To have your information removed, we recommend requesting removal directly through your county’s website.
| Date | Buyer | Sale Price | Title Company |
|---|---|---|---|
| $230,000 | -- | ||
| $230,000 | -- |
Mortgage History
We collect this data history from publicly available records. To have your information removed, we recommend requesting removal directly through your county’s website.
| Date | Status | Borrower | Loan Amount |
|---|---|---|---|
| Open | $200,000 | ||
| Closed | $200,000 |
Tax History
We collect this data history from publicly available records. To have your information removed, we recommend requesting removal directly through your county’s website.
| Year | Tax Paid | Tax Assessment Tax Assessment Total Assessment is a certain percentage of the fair market value that is determined by local assessors to be the total taxable value of land and additions on the property. | Land | Improvement |
|---|---|---|---|---|
| 2025 | $4,276 | $340,700 | $124,800 | $215,900 |
| 2024 | $4,147 | $325,800 | $124,800 | $201,000 |
| 2023 | $3,948 | $288,400 | $113,400 | $175,000 |
| 2022 | $3,810 | $263,700 | $108,100 | $155,600 |
| 2021 | $3,543 | $239,400 | $103,900 | $135,500 |
| 2020 | $3,443 | $236,500 | $100,900 | $135,600 |
| 2019 | $3,294 | $232,600 | $98,900 | $133,700 |
| 2018 | $3,235 | $218,300 | $96,000 | $122,300 |
| 2017 | $3,018 | $207,400 | $96,000 | $111,400 |
| 2016 | $2,882 | $194,500 | $94,200 | $100,300 |
| 2015 | $2,880 | $195,800 | $94,200 | $101,600 |
| 2014 | $2,700 | $181,800 | $89,800 | $92,000 |
Map
- 23 Magnolia St Unit 2
- 24 Magnolia St Unit 16
- 49 Brown St
- 73 Allen Ave
- 48 Hudson St
- 0 Pitas Ave
- 759 Newport Ave
- 120 Carrier Ave
- 82 Pine Rd
- 35 Buena Vista Dr
- 59 Castle Rd
- 44 Castle Rd
- 27 Castle Rd Unit 153
- 3 King Arthur's Ct
- 3 Roundtable Rd
- 3 Robin Hood Ln Unit 179
- 55 Leedham St Unit 1-11
- 56 Baltic St Unit 56
- 24 Lynn Dr
- 9 Romoli Ave Unit 9
Ask me questions while you tour the home.