R
Landlord's Agent in 2024
Rogelio Almaguer
Metro 512 Realty
(512) 850-6054
2 Total Sales
Estimated Value: $407,175
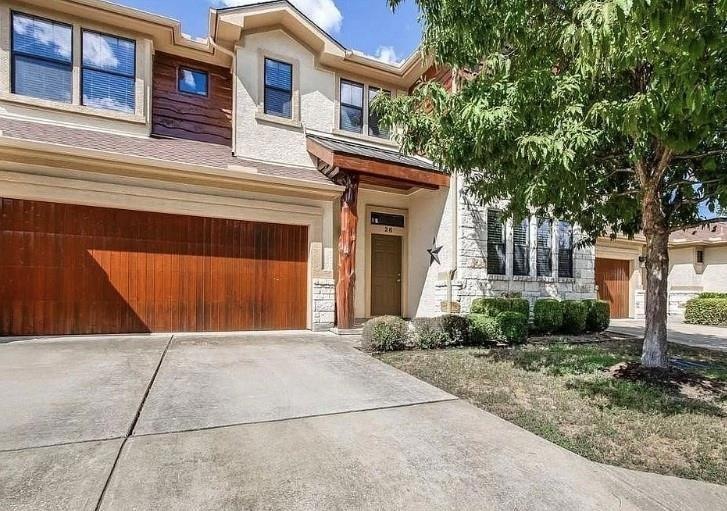
Very Cute 3 bedroom 2.5 bath home. Master downstairs. In a very safe and gated community. Washer and dryer included.
Last Agent to Rent the Property
Metro 512 Realty Brokerage Phone: (512) 479-1300 License #0795058 Listed on: 03/04/2024
Last Renter's Agent
Metro 512 Realty Brokerage Phone: (512) 479-1300 License #0795058 Listed on: 03/04/2024
We collect this data history from publicly available records. To have your information removed, we recommend requesting removal directly through your county’s website.
| Date | Buyer | Sale Price | Title Company |
|---|---|---|---|
| Simmons Anna A | -- | None Available | |
| Benedict James Christopher | -- | Chicago Title Insurance Co |
We collect this data history from publicly available records. To have your information removed, we recommend requesting removal directly through your county’s website.
| Date | Status | Borrower | Loan Amount |
|---|---|---|---|
| Open | Simmons Anna A | $295,329 | |
| Previous Owner | Benedict James Christopher | $233,500 |
| Date | Event | Price | List to Sale | Price per Sq Ft | Prior Sale |
|---|---|---|---|---|---|
| 06/20/2024 06/20/24 | Rented | $2,650 | 0.0% | -- | |
| 05/13/2024 05/13/24 | Price Changed | $2,650 | -3.6% | $1 / Sq Ft | |
| 05/07/2024 05/07/24 | Price Changed | $2,750 | -3.5% | $1 / Sq Ft | |
| 04/23/2024 04/23/24 | Price Changed | $2,850 | -4.8% | $1 / Sq Ft | |
| 04/16/2024 04/16/24 | Price Changed | $2,995 | -3.4% | $2 / Sq Ft | |
| 04/10/2024 04/10/24 | Price Changed | $3,100 | -5.9% | $2 / Sq Ft | |
| 03/04/2024 03/04/24 | For Rent | $3,295 | 0.0% | -- | |
| 04/04/2023 04/04/23 | Rented | $3,295 | -3.1% | -- | |
| 04/03/2023 04/03/23 | Under Contract | -- | -- | -- | |
| 03/09/2023 03/09/23 | For Rent | $3,400 | +6.4% | -- | |
| 03/18/2022 03/18/22 | Rented | $3,195 | 0.0% | -- | |
| 03/11/2022 03/11/22 | Under Contract | -- | -- | -- | |
| 03/07/2022 03/07/22 | For Rent | $3,195 | 0.0% | -- | |
| 03/06/2022 03/06/22 | Under Contract | -- | -- | -- | |
| 03/02/2022 03/02/22 | For Rent | $3,195 | +8.3% | -- | |
| 01/01/2022 01/01/22 | Rented | $2,950 | -7.8% | -- | |
| 12/30/2021 12/30/21 | Under Contract | -- | -- | -- | |
| 10/28/2021 10/28/21 | For Rent | $3,200 | 0.0% | -- | |
| 12/30/2019 12/30/19 | Sold | -- | -- | -- | View Prior Sale |
| 11/11/2019 11/11/19 | Pending | -- | -- | -- | |
| 09/27/2019 09/27/19 | For Sale | $330,000 | 0.0% | $168 / Sq Ft | |
| 07/17/2014 07/17/14 | Rented | $2,175 | -5.2% | -- | |
| 06/20/2014 06/20/14 | Under Contract | -- | -- | -- | |
| 05/02/2014 05/02/14 | For Rent | $2,295 | -- | -- |
| Year | Tax Paid | Tax Assessment Tax Assessment Total Assessment is a certain percentage of the fair market value that is determined by local assessors to be the total taxable value of land and additions on the property. | Land | Improvement |
|---|---|---|---|---|
| 2025 | $8,932 | $436,453 | $143,083 | $293,370 |
| 2023 | $9,004 | $497,656 | $44,713 | $452,943 |
| 2022 | $8,840 | $447,621 | $44,713 | $402,908 |
| 2021 | $7,302 | $335,472 | $44,713 | $290,759 |
| 2020 | $6,991 | $325,921 | $44,713 | $281,208 |
| 2018 | $6,772 | $305,894 | $44,713 | $261,181 |
| 2017 | $6,888 | $308,851 | $44,713 | $264,138 |
| 2016 | $6,327 | $283,690 | $44,713 | $238,977 |
| 2015 | $5,617 | $266,029 | $44,713 | $221,316 |
| 2014 | $5,617 | $256,486 | $44,713 | $211,773 |
R
Landlord's Agent in 2024
Rogelio Almaguer
Metro 512 Realty
(512) 850-6054
2 Total Sales

Buyer's Agent in 2023
Julia Black
Keller Williams Realty
(512) 484-5919
83 Total Sales
Seller's Agent in 2022
Gary Depinto
Metro 512 Realty
(512) 217-6285
63 Total Sales
Seller's Agent in 2022
Tim Gigliotti
BHHS Don Johnson Realtors - SA
(512) 826-3691
61 Total Sales
Buyer's Agent in 2022
Brittney Montgomery
Keller Williams Realty
(337) 258-1889
3 in this area
76 Total Sales
N
Buyer's Agent in 2022
Non Member
Non Member
Source: Unlock MLS (Austin Board of REALTORS®)
MLS Number: 1209386
APN: 718867
Disclaimer: Certain information contained herein is derived from information provided by parties other than Homes.com. All information provided is deemed reliable, but is not guaranteed to be accurate and should be independently verified.
![]() Based on information from the Austin Board of REALTORS® (alternatively, from ACTRIS). Neither the Board nor ACTRIS guarantees or is in any way responsible for its accuracy. All data is provided “AS IS” and with all faults. Data maintained by the Board or ACTRIS may not reflect all real estate activity in the market.
Based on information from the Austin Board of REALTORS® (alternatively, from ACTRIS). Neither the Board nor ACTRIS guarantees or is in any way responsible for its accuracy. All data is provided “AS IS” and with all faults. Data maintained by the Board or ACTRIS may not reflect all real estate activity in the market.
Information being provided is for consumers’ personal, non-commercial use and may not be used for any purpose other than to identify prospective properties consumers may be interested in purchasing. All data is obtained from various sources and may not have been verified by broker or MLS GRID. Supplied Open House Information is subject to change without notice. All information should be independently reviewed and verified for accuracy. Properties may or may not be listed by the office/agent presenting the information. Some IDX listings have been excluded from this website.
Based on information submitted to the MLS GRID
Listings courtesy of Unlock MLS (Austin Board of REALTORS®) as distributed by MLS GRID
Ask me questions while you tour the home.