
Landlord's Agent in 2022
Jill Hamlin
Keller Williams Realty
(281) 658-0378
2 in this area
77 Total Sales
Estimated Value: $338,000 - $380,000
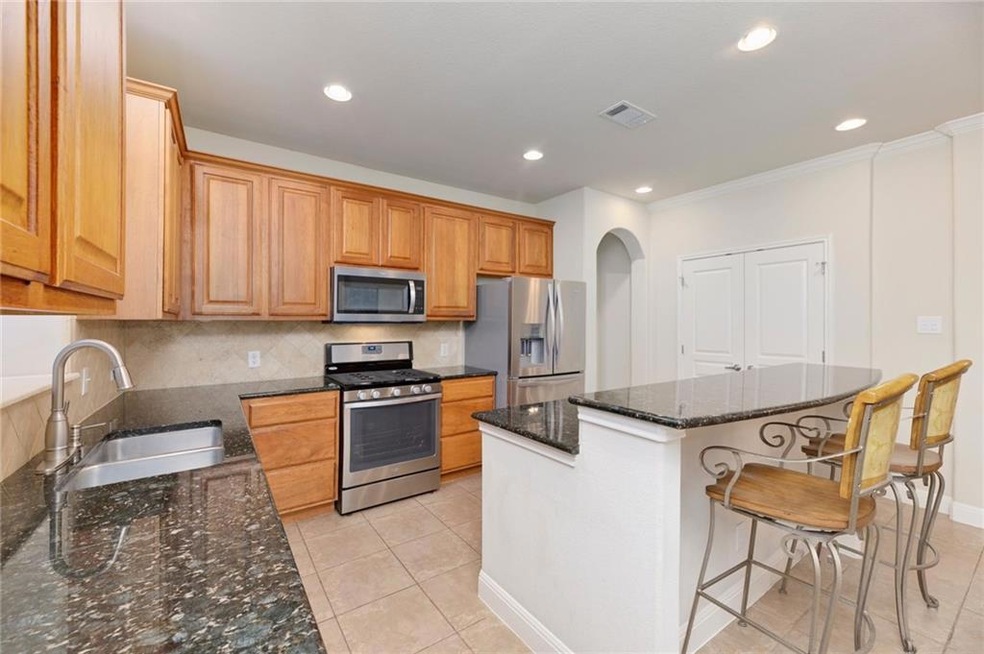
Cute one-story end-unit. 2 bedroom 2 bath plus an office or extra living space. Beautifully maintained. HOA recently painted exterior. Granite counters opens to large living/dining area with lots of natural light. Private and shaded back yard. Gated community. Amenities include pool, splash pad, hike and bike trails and clubhouse. ***Short term only, maximum 6 months***
Last Agent to Rent the Property
Keller Williams Realty License #0506525 Listed on: 01/25/2022
Last Renter's Agent
Non Member
Non Member License #785011
We collect this data history from publicly available records. To have your information removed, we recommend requesting removal directly through your county’s website.
| Date | Buyer | Sale Price | Title Company |
|---|---|---|---|
| Laing Karen | -- | Austin Title Company | |
| Andrus Ingrid | -- | Chicago Title Co |
| Date | Event | Price | List to Sale | Price per Sq Ft | Prior Sale |
|---|---|---|---|---|---|
| 03/01/2022 03/01/22 | Rented | $2,400 | 0.0% | -- | |
| 02/12/2022 02/12/22 | Under Contract | -- | -- | -- | |
| 01/31/2022 01/31/22 | Price Changed | $2,400 | -4.0% | $2 / Sq Ft | |
| 01/25/2022 01/25/22 | For Rent | $2,500 | 0.0% | -- | |
| 01/21/2022 01/21/22 | Sold | -- | -- | -- | View Prior Sale |
| 01/10/2022 01/10/22 | Pending | -- | -- | -- | |
| 01/06/2022 01/06/22 | For Sale | $375,000 | +21.4% | $251 / Sq Ft | |
| 06/27/2019 06/27/19 | Sold | -- | -- | -- | View Prior Sale |
| 06/07/2019 06/07/19 | Pending | -- | -- | -- | |
| 05/31/2019 05/31/19 | For Sale | $309,000 | -- | $206 / Sq Ft |
| Year | Tax Paid | Tax Assessment Tax Assessment Total Assessment is a certain percentage of the fair market value that is determined by local assessors to be the total taxable value of land and additions on the property. | Land | Improvement |
|---|---|---|---|---|
| 2025 | $7,511 | $367,021 | $143,083 | $223,938 |
| 2023 | $7,784 | $430,208 | $44,713 | $385,495 |
| 2022 | $6,345 | $321,268 | $0 | $0 |
| 2021 | $6,503 | $292,062 | $44,713 | $247,349 |
| 2020 | $6,201 | $289,129 | $44,713 | $244,416 |
| 2018 | $5,995 | $270,756 | $44,713 | $226,043 |
| 2017 | $6,095 | $273,295 | $44,713 | $228,582 |
| 2016 | $5,609 | $251,506 | $44,713 | $206,793 |
| 2015 | $3,545 | $236,210 | $44,713 | $191,497 |
| 2014 | $3,545 | $226,855 | $44,713 | $182,142 |
Landlord's Agent in 2022
Jill Hamlin
Keller Williams Realty
(281) 658-0378
2 in this area
77 Total Sales
A
Seller's Agent in 2022
Andrea Sanchez
Luisa Mauro Real Estate
(512) 923-1702
4 in this area
29 Total Sales
N
Tenant's Agent in 2022
Non Member
Non Member
M
Seller's Agent in 2019
Mike Conner
Stanberry REALTORS
(512) 785-7490
2 in this area
10 Total Sales
Buyer's Agent in 2019
Luisa Mauro
Luisa Mauro Real Estate
(425) 406-0482
4 in this area
249 Total Sales
Source: Unlock MLS (Austin Board of REALTORS®)
MLS Number: 6477760
APN: 718880
Disclaimer: Certain information contained herein is derived from information provided by parties other than Homes.com. All information provided is deemed reliable, but is not guaranteed to be accurate and should be independently verified.
![]() Based on information from the Austin Board of REALTORS® (alternatively, from ACTRIS). Neither the Board nor ACTRIS guarantees or is in any way responsible for its accuracy. All data is provided “AS IS” and with all faults. Data maintained by the Board or ACTRIS may not reflect all real estate activity in the market.
Based on information from the Austin Board of REALTORS® (alternatively, from ACTRIS). Neither the Board nor ACTRIS guarantees or is in any way responsible for its accuracy. All data is provided “AS IS” and with all faults. Data maintained by the Board or ACTRIS may not reflect all real estate activity in the market.
Information being provided is for consumers’ personal, non-commercial use and may not be used for any purpose other than to identify prospective properties consumers may be interested in purchasing. All data is obtained from various sources and may not have been verified by broker or MLS GRID. Supplied Open House Information is subject to change without notice. All information should be independently reviewed and verified for accuracy. Properties may or may not be listed by the office/agent presenting the information. Some IDX listings have been excluded from this website.
Based on information submitted to the MLS GRID
Listings courtesy of Unlock MLS (Austin Board of REALTORS®) as distributed by MLS GRID
Ask me questions while you tour the home.