675 E Main St Winterville, NC 28590
Estimated Value: $233,000 - $278,000
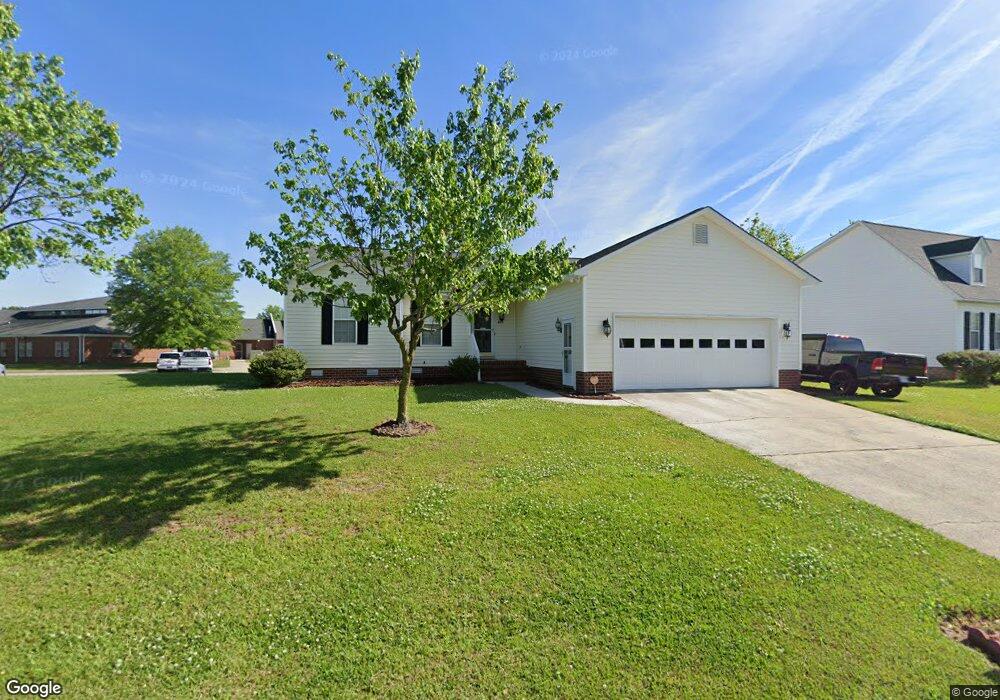
About This Home
This home is located at 675 E Main St, Winterville, NC 28590 and is currently estimated at $260,616, approximately $166 per square foot. 675 E Main St is a home located in Pitt County with nearby schools including W.H. Robinson Elementary School, A.G. Cox Middle School, and South Central High School.
Ownership History
We collect this data history from publicly available records. To have your information removed, we recommend requesting removal directly through your county’s website.
Purchase Details
Home Financials for this Owner
Home Financials are based on the most recent Mortgage that was taken out on this home.Home Values in the Area
Average Home Value in this Area
Purchase History
We collect this data history from publicly available records. To have your information removed, we recommend requesting removal directly through your county’s website.
| Date | Buyer | Sale Price | Title Company |
|---|---|---|---|
| $143,000 | None Available |
Mortgage History
We collect this data history from publicly available records. To have your information removed, we recommend requesting removal directly through your county’s website.
| Date | Status | Borrower | Loan Amount |
|---|---|---|---|
| Open | $147,050 |
Tax History
We collect this data history from publicly available records. To have your information removed, we recommend requesting removal directly through your county’s website.
| Year | Tax Paid | Tax Assessment Tax Assessment Total Assessment is a certain percentage of the fair market value that is determined by local assessors to be the total taxable value of land and additions on the property. | Land | Improvement |
|---|---|---|---|---|
| 2025 | $1,751 | $256,862 | $40,000 | $216,862 |
| 2024 | $1,739 | $256,862 | $40,000 | $216,862 |
| 2023 | $1,429 | $176,948 | $22,000 | $154,948 |
| 2022 | $1,436 | $176,948 | $22,000 | $154,948 |
| 2021 | $1,429 | $176,948 | $22,000 | $154,948 |
| 2020 | $1,438 | $176,948 | $22,000 | $154,948 |
| 2019 | $1,245 | $150,656 | $20,000 | $130,656 |
| 2018 | $1,189 | $150,656 | $20,000 | $130,656 |
| 2017 | $1,189 | $150,656 | $20,000 | $130,656 |
| 2016 | $1,154 | $150,656 | $20,000 | $130,656 |
| 2015 | $1,154 | $149,112 | $20,000 | $129,112 |
| 2014 | $1,154 | $149,112 | $20,000 | $129,112 |
Map
- 720 E Main St
- 4962 Old Tar Rd
- 416 Edenton Ct
- 2705 Tonya Ct
- 2354 Blackstone Dr
- 2573 Graham St
- 614 Brookfield Dr
- 378 Primrose Ln
- 829 Corbett St
- 655 Norberry Dr
- 2674 Garland Rd
- 604 Stillwater Dr
- 306 Johnson Ln
- 891 Corbett St
- 347 Jeanette St
- 2243 Black Horse Ln
- 911 Hunter Grace Dr
- 351 Johnson Ln
- 929 Hunter Grace Dr
- 2823 Walbrook Ct
Ask me questions while you tour the home.