Estimated Value: $115,000 - $140,000
About This Home
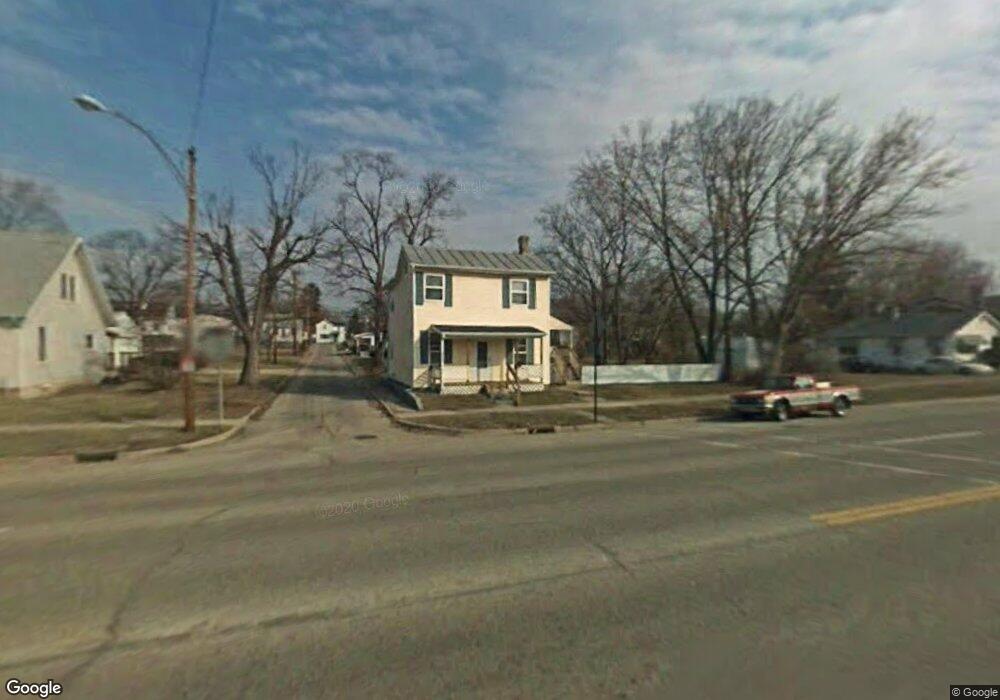
This home is located at 676 E Main St, Xenia, OH 45385 and is currently estimated at $126,003, approximately $87 per square foot. 676 E Main St is a home located in Greene County with nearby schools including Xenia High School, Summit Academy Community School for Alternative Learners - Xenia, and Legacy Christian Academy.
Ownership History
We collect this data history from publicly available records. To have your information removed, we recommend requesting removal directly through your county’s website.
Purchase Details
Purchase Details
Purchase Details
Home Values in the Area
Average Home Value in this Area
Purchase History
We collect this data history from publicly available records. To have your information removed, we recommend requesting removal directly through your county’s website.
| Date | Buyer | Sale Price | Title Company |
|---|---|---|---|
| $12,500 | Accutitle Agency Inc | ||
| $24,000 | -- | ||
| $24,000 | Accutitle Agency Inc |
Tax History
We collect this data history from publicly available records. To have your information removed, we recommend requesting removal directly through your county’s website.
| Year | Tax Paid | Tax Assessment Tax Assessment Total Assessment is a certain percentage of the fair market value that is determined by local assessors to be the total taxable value of land and additions on the property. | Land | Improvement |
|---|---|---|---|---|
| 2025 | $1,165 | $26,740 | $1,430 | $25,310 |
| 2024 | $1,165 | $26,740 | $1,430 | $25,310 |
| 2023 | $1,144 | $26,740 | $1,430 | $25,310 |
| 2022 | $943 | $18,800 | $1,300 | $17,500 |
| 2021 | $956 | $18,800 | $1,300 | $17,500 |
| 2020 | $916 | $18,800 | $1,300 | $17,500 |
| 2019 | $856 | $16,540 | $1,690 | $14,850 |
| 2018 | $859 | $16,540 | $1,690 | $14,850 |
| 2017 | $834 | $16,540 | $1,690 | $14,850 |
| 2016 | $837 | $15,810 | $1,690 | $14,120 |
| 2015 | $839 | $15,810 | $1,690 | $14,120 |
| 2014 | $804 | $15,810 | $1,690 | $14,120 |
Map
- 607 E Main St
- 0 N Patton St
- 00 N Patton St
- 60 Jackson St
- 560 Louise Dr
- 573 Louise Dr
- 598 Louise Dr
- 603 Louise Dr
- 149 Third
- 1472 Willowbridge Ct
- 286 Washington St
- 345 Washington St
- 842 Murray Hill Dr
- 617 Marshall Dr
- 30 Leaman St
- 641 Kennedy St
- 687 Eden Roc Dr
- 770 S Columbus St
- 150-150 1/2 W Church St
- 423 Home Ave
- 1359 E Main St
- 660 E Main St
- 37 N Williams Ave
- 652 E Main St
- 706 E Main St
- 51 N Williams Ave
- 712 E Main St
- 646 E Main St
- 697 E Main St Unit 701 1/2
- 683 E Market St
- 683 E Main St
- 665 E Main St
- 655 E Main St
- 667 E Market St
- 659 E Market St
- 697 E Market St
- 707 E Main St
- 645 E Main St
- 651 E Market St
- 713 E Main St
Ask me questions while you tour the home.