676 E Main St Yarmouth, ME 04096
Yarmouth AreaEstimated Value: $512,000 - $653,000
About This Home
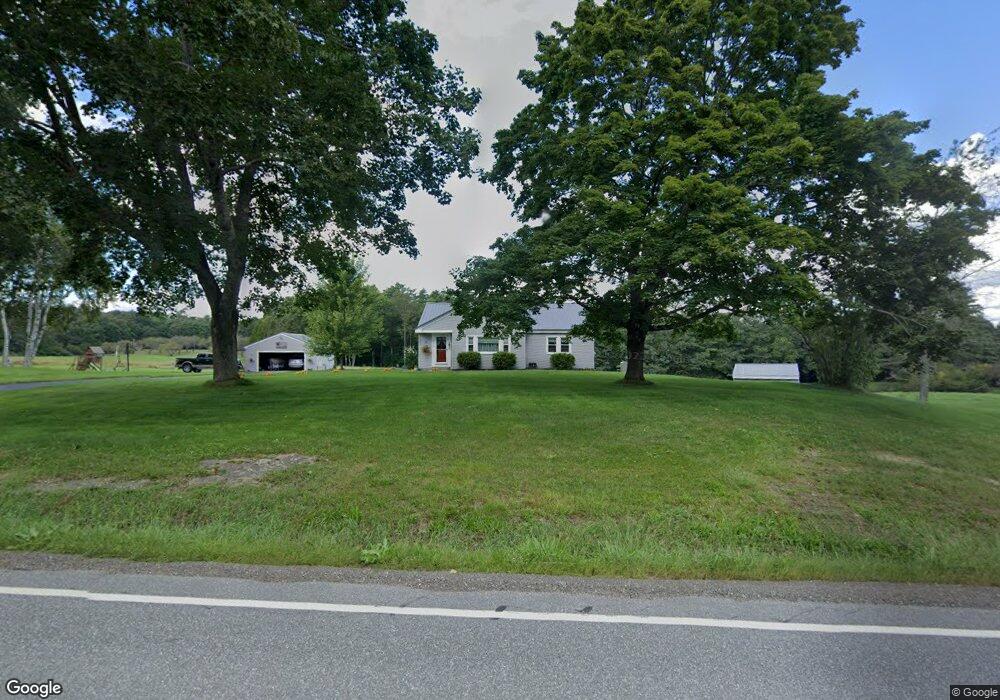
This home is located at 676 E Main St, Yarmouth, ME 04096 and is currently estimated at $591,941, approximately $500 per square foot. 676 E Main St is a home located in Cumberland County with nearby schools including William H. Rowe School, Yarmouth Elementary School, and Frank H. Harrison Middle School.
Ownership History
We collect this data history from publicly available records. To have your information removed, we recommend requesting removal directly through your county’s website.
Purchase Details
Home Financials for this Owner
Home Financials are based on the most recent Mortgage that was taken out on this home.Home Values in the Area
Average Home Value in this Area
Purchase History
We collect this data history from publicly available records. To have your information removed, we recommend requesting removal directly through your county’s website.
| Date | Buyer | Sale Price | Title Company |
|---|---|---|---|
| -- | -- |
Mortgage History
We collect this data history from publicly available records. To have your information removed, we recommend requesting removal directly through your county’s website.
| Date | Status | Borrower | Loan Amount |
|---|---|---|---|
| Closed | $50,522 | ||
| Closed | $170,000 | ||
| Closed | $15,450 | ||
| Closed | $162,850 | ||
| Closed | $140,000 |
Tax History
We collect this data history from publicly available records. To have your information removed, we recommend requesting removal directly through your county’s website.
| Year | Tax Paid | Tax Assessment Tax Assessment Total Assessment is a certain percentage of the fair market value that is determined by local assessors to be the total taxable value of land and additions on the property. | Land | Improvement |
|---|---|---|---|---|
| 2025 | $7,343 | $504,700 | $188,200 | $316,500 |
| 2024 | $6,962 | $271,200 | $130,000 | $141,200 |
| 2023 | $6,384 | $271,200 | $130,000 | $141,200 |
| 2022 | $5,863 | $271,200 | $130,000 | $141,200 |
| 2021 | $4,924 | $271,200 | $130,000 | $141,200 |
| 2020 | $4,840 | $271,200 | $130,000 | $141,200 |
| 2019 | $5,115 | $271,200 | $130,000 | $141,200 |
| 2018 | $4,827 | $271,200 | $130,000 | $141,200 |
| 2017 | $4,654 | $271,200 | $130,000 | $141,200 |
| 2016 | $4,627 | $271,200 | $130,000 | $141,200 |
| 2015 | $4,459 | $206,800 | $100,100 | $106,700 |
| 2014 | $4,467 | $206,800 | $100,100 | $106,700 |
| 2013 | $4,550 | $206,800 | $0 | $0 |
Map
- 232 Bluff Rd Unit 232
- 177 Bluff Rd Unit 20
- 430 E Main St
- 4 Foxglove Ct
- 29 Plimouth Way
- 30 Melissa Dr
- 607 Granite St
- 27 Bayview St
- 27 Gail Ln
- 73 Autumn Ln
- 4 Ellen Cir
- 62 Sisquisic Trail
- 98 Harborview Dr
- 14 Marshview Dr
- 15 Blueberry Cove
- 61 Crane Farm Way
- 52 Blueberry Cove Rd Unit 52
- 109 Main St
- 53 Waters Edge Dr
- 0 Hodsdon Unit 1667974
Ask me questions while you tour the home.