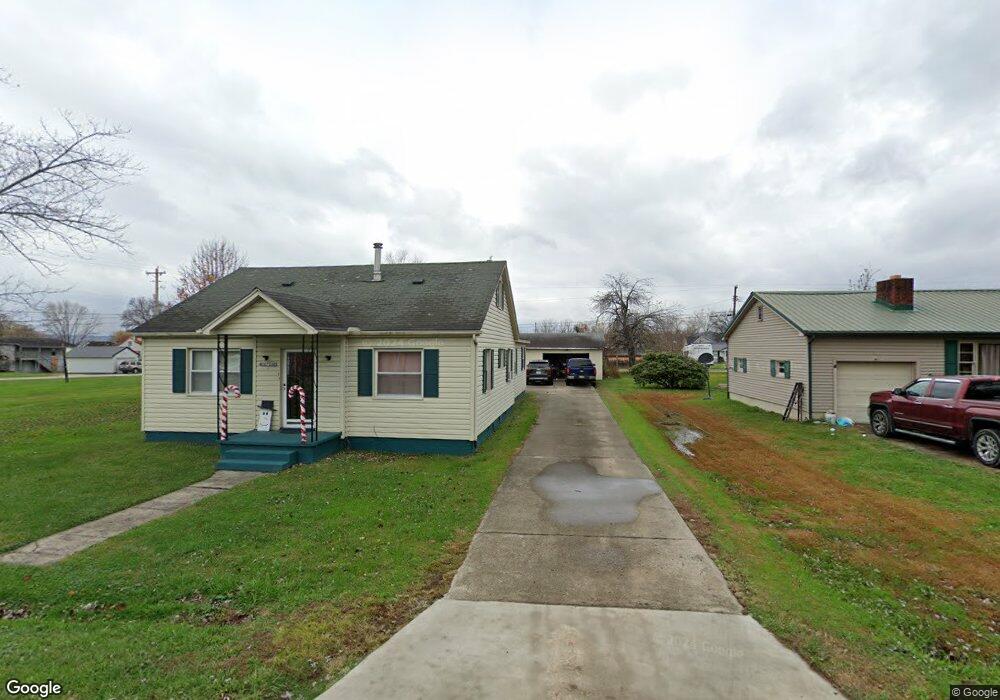
68 E 3rd Ave South Shore, KY 41175
Estimated Value: $77,000 - $116,740
Studio
--
Bath
724
Sq Ft
$132/Sq Ft
Est. Value
About This Home
This home is located at 68 E 3rd Ave, South Shore, KY 41175 and is currently estimated at $95,435, approximately $131 per square foot. 68 E 3rd Ave is a home located in Greenup County with nearby schools including Greenup County High School, Notre Dame Elementary School, and Portsmouth Stem Academy.
Ownership History
Date
Name
Owned For
Owner Type
Purchase Details
Closed on
Jul 9, 2018
Sold by
Adkins Tana
Bought by
Adkins Tana J
Current Estimated Value
Home Financials for this Owner
Home Financials are based on the most recent Mortgage that was taken out on this home.
Original Mortgage
$82,828
Outstanding Balance
$71,632
Interest Rate
4.5%
Mortgage Type
New Conventional
Estimated Equity
$23,803
Create a Home Valuation Report for This Property
The Home Valuation Report is an in-depth analysis detailing your home's value as well as a comparison with similar homes in the area
Purchase History
| Date | Buyer | Sale Price | Title Company |
|---|---|---|---|
| Adkins Tana J | $82,000 | Wesbanco Title |
Source: Public Records
Mortgage History
| Date | Status | Borrower | Loan Amount |
|---|---|---|---|
| Open | Adkins Tana J | $82,828 |
Source: Public Records
Tax History
| Year | Tax Paid | Tax Assessment Tax Assessment Total Assessment is a certain percentage of the fair market value that is determined by local assessors to be the total taxable value of land and additions on the property. | Land | Improvement |
|---|---|---|---|---|
| 2025 | $1,620 | $82,000 | $15,000 | $67,000 |
| 2024 | $1,611 | $82,000 | $15,000 | $67,000 |
| 2023 | $1,528 | $82,000 | $15,000 | $67,000 |
| 2022 | $1,493 | $82,000 | $15,000 | $67,000 |
| 2021 | $1,484 | $82,000 | $15,000 | $67,000 |
| 2020 | $1,438 | $82,000 | $15,000 | $67,000 |
| 2019 | $1,497 | $82,000 | $15,000 | $67,000 |
| 2018 | -- | $32,920 | $10,000 | $22,920 |
| 2017 | -- | $32,920 | $10,000 | $22,920 |
| 2016 | -- | $32,920 | $10,000 | $22,920 |
| 2015 | -- | $32,920 | $10,000 | $22,920 |
| 2014 | $574 | $32,920 | $10,000 | $22,920 |
| 2011 | -- | $32,920 | $10,000 | $22,920 |
Source: Public Records
Map
Nearby Homes
- 159 E Third Avenue (Blue)
- 159 E Third Avenue (Tan)
- 175 E 3rd Ave
- 45 W 3rd Ave
- 199 James E Hannah Dr
- 1381 Kentucky 7
- 1913 6th St
- 1705 Williams St
- 1706 Jackson St
- 1810 6th St
- 437 Murray St
- 1624 6th St
- 1635 6th St
- 1324 Center St
- 1538 6th St
- 1423 Center St
- 1530 Linden Ave
- 3015 Gallia St
- 1810 High St
- 1707 Grandview Ave Unit 2
Your Personal Tour Guide
Ask me questions while you tour the home.