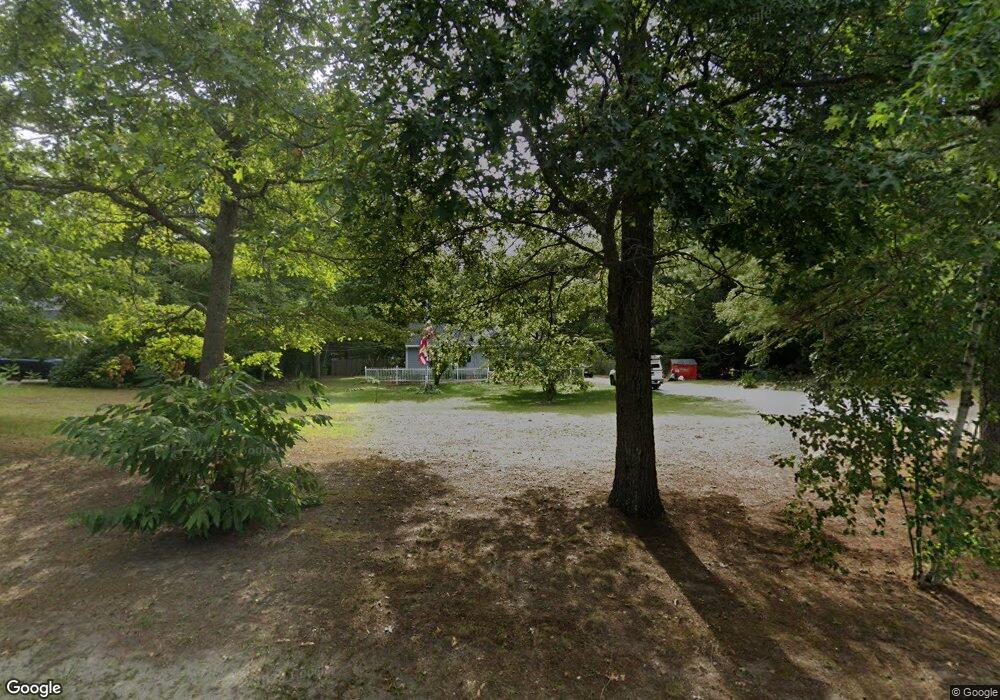
68 Forrest St Berkley, MA 02779
Estimated Value: $366,000 - $506,000
3
Beds
2
Baths
1,092
Sq Ft
$421/Sq Ft
Est. Value
About This Home
This home is located at 68 Forrest St, Berkley, MA 02779 and is currently estimated at $460,244, approximately $421 per square foot. 68 Forrest St is a home located in Bristol County with nearby schools including Berkley Community School and Our Lady of Lourdes School.
Ownership History
Date
Name
Owned For
Owner Type
Purchase Details
Closed on
Nov 26, 2007
Sold by
Rosebrock Franklin E and Steele Tracy Leigh
Bought by
Steele Tracy Leigh and Rosebrock Tracy Leigh
Current Estimated Value
Home Financials for this Owner
Home Financials are based on the most recent Mortgage that was taken out on this home.
Original Mortgage
$258,400
Outstanding Balance
$164,568
Interest Rate
6.42%
Mortgage Type
Purchase Money Mortgage
Estimated Equity
$295,676
Create a Home Valuation Report for This Property
The Home Valuation Report is an in-depth analysis detailing your home's value as well as a comparison with similar homes in the area
Purchase History
| Date | Buyer | Sale Price | Title Company |
|---|---|---|---|
| Steele Tracy Leigh | $126,000 | -- |
Source: Public Records
Mortgage History
| Date | Status | Borrower | Loan Amount |
|---|---|---|---|
| Open | Steele Tracy Leigh | $258,400 |
Source: Public Records
Tax History
| Year | Tax Paid | Tax Assessment Tax Assessment Total Assessment is a certain percentage of the fair market value that is determined by local assessors to be the total taxable value of land and additions on the property. | Land | Improvement |
|---|---|---|---|---|
| 2025 | $46 | $383,500 | $140,900 | $242,600 |
| 2024 | $4,381 | $351,900 | $121,300 | $230,600 |
| 2023 | $4,318 | $326,600 | $121,300 | $205,300 |
| 2022 | $4,176 | $303,700 | $105,500 | $198,200 |
| 2021 | $4,067 | $284,800 | $100,400 | $184,400 |
| 2020 | $4,045 | $278,400 | $88,800 | $189,600 |
| 2019 | $3,941 | $269,200 | $88,800 | $180,400 |
| 2018 | $3,613 | $257,700 | $85,400 | $172,300 |
| 2017 | $3,562 | $249,100 | $95,700 | $153,400 |
| 2016 | $3,464 | $233,400 | $95,700 | $137,700 |
| 2015 | $3,276 | $235,500 | $95,700 | $139,800 |
| 2014 | $3,141 | $245,200 | $103,800 | $141,400 |
Source: Public Records
Map
Nearby Homes
Your Personal Tour Guide
Ask me questions while you tour the home.