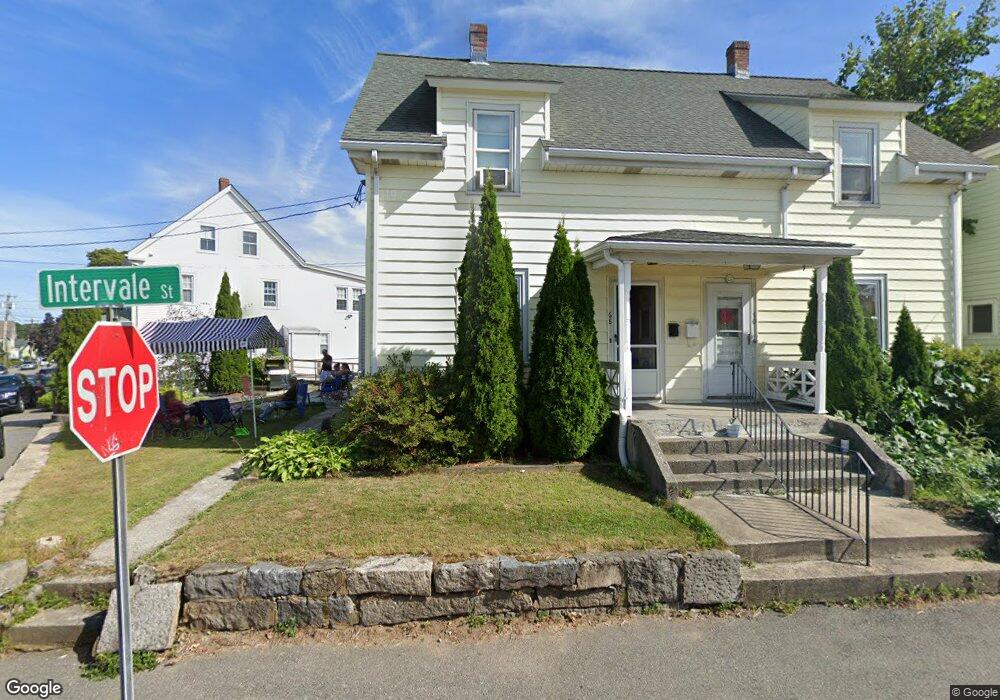
68 Intervale St Quincy, MA 02169
South Quincy NeighborhoodEstimated Value: $725,236 - $826,000
6
Beds
2
Baths
2,070
Sq Ft
$384/Sq Ft
Est. Value
About This Home
This home is located at 68 Intervale St, Quincy, MA 02169 and is currently estimated at $794,309, approximately $383 per square foot. 68 Intervale St is a home located in Norfolk County with nearby schools including South West Middle School, Lincoln-Hancock Community School, and Quincy High School.
Ownership History
Date
Name
Owned For
Owner Type
Purchase Details
Closed on
Jan 13, 2016
Sold by
Li Xu H
Bought by
68 Intervale Street Rt and Li Xu H
Current Estimated Value
Purchase Details
Closed on
Aug 27, 2012
Sold by
Li Hong Y
Bought by
Li Xu H
Purchase Details
Closed on
Sep 27, 2011
Sold by
Chang Cheng C
Bought by
Li Xu H
Purchase Details
Closed on
Mar 7, 2011
Sold by
Henry F Marani T and Christmas Cynthia M
Bought by
Chang Cheng C and Li Hong Y
Create a Home Valuation Report for This Property
The Home Valuation Report is an in-depth analysis detailing your home's value as well as a comparison with similar homes in the area
Home Values in the Area
Average Home Value in this Area
Purchase History
| Date | Buyer | Sale Price | Title Company |
|---|---|---|---|
| 68 Intervale Street Rt | -- | -- | |
| Li Xu H | -- | -- | |
| Li Xu H | -- | -- | |
| Chang Cheng C | $320,000 | -- |
Source: Public Records
Tax History
| Year | Tax Paid | Tax Assessment Tax Assessment Total Assessment is a certain percentage of the fair market value that is determined by local assessors to be the total taxable value of land and additions on the property. | Land | Improvement |
|---|---|---|---|---|
| 2025 | $7,603 | $659,400 | $275,000 | $384,400 |
| 2024 | $7,162 | $635,500 | $261,900 | $373,600 |
| 2023 | $6,800 | $611,000 | $238,100 | $372,900 |
| 2022 | $6,631 | $553,500 | $198,500 | $355,000 |
| 2021 | $6,291 | $518,200 | $198,500 | $319,700 |
| 2020 | $6,595 | $530,600 | $198,500 | $332,100 |
| 2019 | $5,843 | $465,600 | $187,200 | $278,400 |
| 2018 | $5,823 | $436,500 | $173,300 | $263,200 |
| 2017 | $6,005 | $423,800 | $165,100 | $258,700 |
| 2016 | $5,336 | $371,600 | $143,500 | $228,100 |
| 2015 | $5,246 | $359,300 | $143,500 | $215,800 |
| 2014 | $4,555 | $306,500 | $143,500 | $163,000 |
Source: Public Records
Map
Nearby Homes
- 79 Gilbert St
- 56 Penn St Unit 4
- 21 Totman St Unit 205
- 21 Totman St Unit 409
- 21 Totman St Unit 203
- 21 Totman St Unit 403
- 21 Totman St Unit 301
- 21 Totman St Unit 208
- 21 Totman St Unit PH-401
- 21 Totman St Unit 204
- 51 Branch St Unit 3
- 87 Village Dr
- 132 Centre St
- 8 Jackson St Unit B1
- 8 Jackson St Unit B4
- 91 Garfield St
- 99 Verchild St
- 21 Arthur St
- 9 Westford St
- 52 Packards Ln Unit 4
- 70 Intervale St Unit 1
- 72 Intervale St
- 52 Brooks Ave
- 50 Brooks Ave
- 13 Rodman St
- 17 Rodman St
- 51 Brooks Ave Unit 2
- 51 Brooks Ave Unit 1
- 18 Taber St
- 49 Brooks Ave
- 49 Brooks Ave Unit 2
- 20 Taber St
- 42 Brooks Ave
- 65 Brooks Ave
- 26 Taber St
- 26 Taber St Unit 1
- 26 Taber St Unit 26
- 28 Taber St Unit 1
- 61 Intervale St
- 47 Brooks Ave
Your Personal Tour Guide
Ask me questions while you tour the home.