Estimated Value: $663,000
3
Beds
2
Baths
2,086
Sq Ft
$318/Sq Ft
Est. Value
About This Home
This home is located at 68 N 4400 E, Rigby, ID 83442 and is currently priced at $663,000, approximately $317 per square foot. 68 N 4400 E is a home located in Jefferson County with nearby schools including South Fork Elementary School, Rigby Middle School, and Rigby High School.
Ownership History
Date
Name
Owned For
Owner Type
Purchase Details
Closed on
Jul 24, 2023
Sold by
Larsen Kevin
Bought by
Larsen Kevin
Current Estimated Value
Purchase Details
Closed on
Aug 25, 2022
Sold by
Larsen and Melanie
Bought by
Larsen Kevin S and Hill Melanie
Home Financials for this Owner
Home Financials are based on the most recent Mortgage that was taken out on this home.
Original Mortgage
$318,000
Interest Rate
5.3%
Mortgage Type
New Conventional
Purchase Details
Closed on
Jan 13, 2022
Sold by
K Larsen Construction Inc
Bought by
K Larsen Construction Inc
Purchase Details
Closed on
Nov 1, 2021
Sold by
Jourden Jim
Bought by
K Larsen Construction Inc
Home Financials for this Owner
Home Financials are based on the most recent Mortgage that was taken out on this home.
Original Mortgage
$300,000
Interest Rate
2.8%
Mortgage Type
Commercial
Create a Home Valuation Report for This Property
The Home Valuation Report is an in-depth analysis detailing your home's value as well as a comparison with similar homes in the area
Purchase History
| Date | Buyer | Sale Price | Title Company |
|---|---|---|---|
| Larsen Kevin | -- | None Listed On Document | |
| Larsen Kevin S | -- | -- | |
| K Larsen Construction Inc | $101 | Alliance Title | |
| K Larsen Construction Inc | -- | Alliance Ttl Rexburg Office | |
| K Larsen Construction Inc | -- | Alliance Ttl Rexburg Office |
Source: Public Records
Mortgage History
| Date | Status | Borrower | Loan Amount |
|---|---|---|---|
| Previous Owner | Larsen Kevin S | $318,000 | |
| Previous Owner | K Larsen Construction Inc | $300,000 |
Source: Public Records
Tax History
| Year | Tax Paid | Tax Assessment Tax Assessment Total Assessment is a certain percentage of the fair market value that is determined by local assessors to be the total taxable value of land and additions on the property. | Land | Improvement |
|---|---|---|---|---|
| 2023 | $2,682 | $670,731 | $0 | $0 |
| 2022 | $3,439 | $606,633 | $0 | $0 |
| 2021 | $3,220 | $462,914 | $0 | $0 |
| 2020 | $2,573 | $424,797 | $0 | $0 |
| 2019 | $2,921 | $382,110 | $0 | $0 |
| 2018 | $2,665 | $343,269 | $0 | $0 |
| 2017 | $2,535 | $323,318 | $0 | $0 |
| 2016 | $2,373 | $205,992 | $0 | $0 |
| 2015 | $2,264 | $189,318 | $0 | $0 |
| 2014 | $2,333 | $194,978 | $0 | $0 |
| 2013 | -- | $194,993 | $0 | $0 |
Source: Public Records
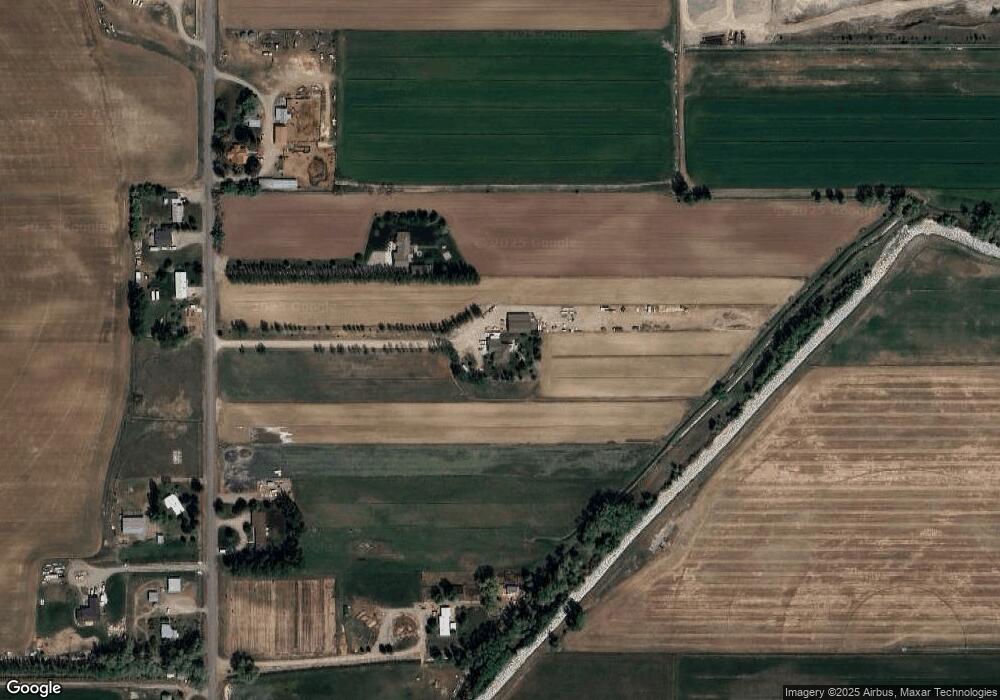
Map
Nearby Homes
- 119 N 4400 E
- 4434 E 150 N
- 14064 N 105 E
- 13857 N 115 E
- 13733 N 115 E
- 4563 E 75 N
- L27Blk1 4544 E
- 4244 E 100 N
- TBDLot1 N 4400 E
- TBD Lot 2 N 4400 E
- TBDLot2 N 4400 E
- TBDLot3 N 4400 E
- TBD Lot 1 N 4400 E
- TBD Lot 3 N 4400 E
- 4330 E 240 N
- 4548 E 250 N
- 4389 E 278 N
- 4377 E 278 N
- TBD N 4300 E
- TBD N 4300 E Unit 2
Your Personal Tour Guide
Ask me questions while you tour the home.