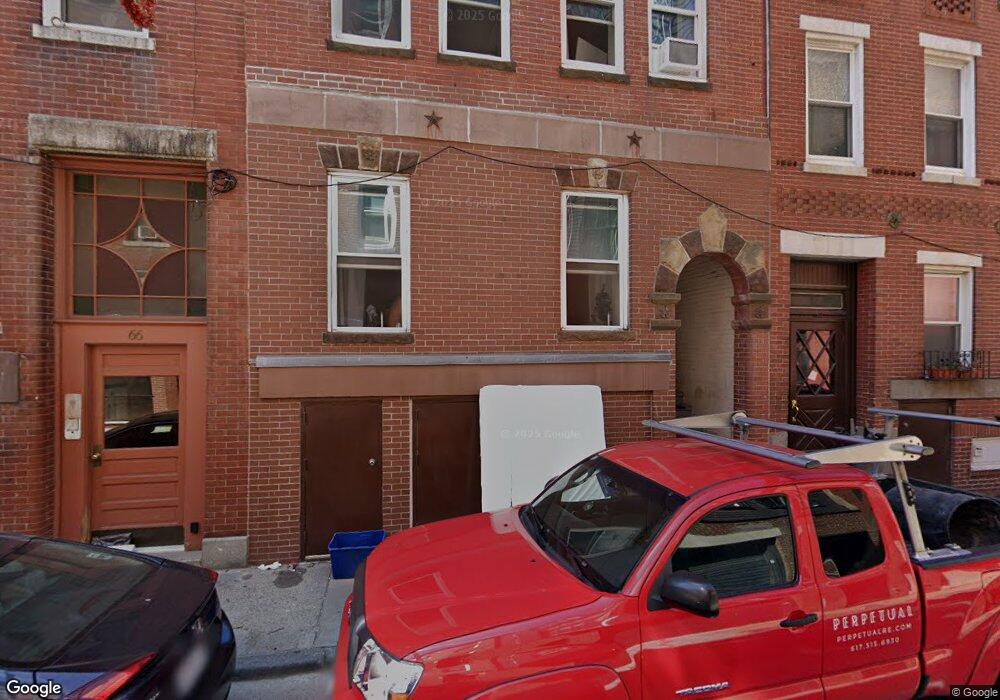
68 N Margin St Boston, MA 02113
North End Neighborhood
2
Beds
--
Bath
9,999
Sq Ft
--
Built
About This Home
Beautiful apartment located at 68 N MARGIN ST
312340 748
Create a Home Valuation Report for This Property
The Home Valuation Report is an in-depth analysis detailing your home's value as well as a comparison with similar homes in the area
Home Values in the Area
Average Home Value in this Area
Property History
We collect this data history from publicly available records. To have your information removed, we recommend requesting removal directly through your county’s website.
| Date | Event | Price | List to Sale | Price per Sq Ft |
|---|---|---|---|---|
| 10/08/2024 10/08/24 | Off Market | $3,400 | -- | -- |
| 10/08/2024 10/08/24 | Off Market | $4,500 | -- | -- |
| 10/08/2024 10/08/24 | Off Market | $3,400 | -- | -- |
| 10/08/2024 10/08/24 | Off Market | $4,100 | -- | -- |
| 09/01/2024 09/01/24 | For Rent | $4,225 | -6.1% | -- |
| 08/31/2024 08/31/24 | For Rent | $4,500 | +9.8% | -- |
| 08/01/2024 08/01/24 | For Rent | $4,100 | +20.6% | -- |
| 07/01/2024 07/01/24 | For Rent | $3,400 | 0.0% | -- |
| 12/31/2023 12/31/23 | For Rent | $3,400 | -- | -- |
Tax History
We collect this data history from publicly available records. To have your information removed, we recommend requesting removal directly through your county’s website.
| Year | Tax Paid | Tax Assessment Tax Assessment Total Assessment is a certain percentage of the fair market value that is determined by local assessors to be the total taxable value of land and additions on the property. | Land | Improvement |
|---|---|---|---|---|
| 2025 | $13,185 | $1,138,600 | $395,600 | $743,000 |
| 2024 | $12,664 | $1,161,800 | $395,600 | $766,200 |
| 2023 | $12,798 | $1,191,600 | $395,600 | $796,000 |
| 2022 | $12,745 | $1,171,400 | $395,600 | $775,800 |
| 2021 | $12,443 | $1,166,200 | $390,400 | $775,800 |
| 2020 | $11,904 | $1,127,300 | $390,400 | $736,900 |
| 2019 | $11,689 | $1,109,000 | $390,400 | $718,600 |
| 2018 | $11,166 | $1,065,500 | $375,900 | $689,600 |
| 2017 | $10,876 | $1,027,000 | $357,400 | $669,600 |
| 2016 | $10,808 | $982,500 | $331,000 | $651,500 |
| 2015 | $10,693 | $883,000 | $295,400 | $587,600 |
| 2014 | $9,794 | $778,500 | $250,600 | $527,900 |
Source: Public Records
Map
Nearby Homes
- 47A N Margin St
- 51 N Margin St
- 51 N Margin St Unit 3
- 51 N Margin St Unit 1
- 51 N Margin St Unit 2
- 51 N Margin St Unit 4
- 62 N Margin St Unit 3
- 162 Endicott St Unit 2
- 133 Salem St
- 11 Wiget St Unit 4
- 9 N Margin St Unit 2
- 159 Salem St Unit 4
- 7 Stillman Place Unit 5
- 52 Cooper St Unit 2
- 52 Cooper St Unit 1
- 136 Prince St Unit 3
- 8 Wiget St Unit 1
- 8 Wiget St Unit 2
- 44 Prince St Unit 402
- 46 N Bennet St Unit 1
- 47 N Margin St Unit 3
- 47 N Margin St Unit 3
- 47 N Margin St
- 47 N Margin St Unit 1
- 49 N Margin St Unit 3
- 49 N Margin St Unit 2
- 49 N Margin St Unit 1
- 49 N Margin St Unit PH
- 68 N Margin St Unit 2
- 68 N Margin St Unit 5F
- 68 N Margin St Unit A
- 68 N Margin St Unit B
- 68 N Margin St Unit C
- 68 N Margin St Unit 68
- 68 N Margin St Unit 2R
- 68 N Margin St Unit 6
- 68 N Margin St Unit 3
- 68 N Margin St Unit 1
- 66 N Margin St Unit 64-4R
- 66 N Margin St Unit 4R
Your Personal Tour Guide
Ask me questions while you tour the home.