
Seller's Agent in 2026
Michael Connor
Connor Real Estate
(781) 581-5940
3 in this area
91 Total Sales
Estimated Value: $643,000 - $674,203
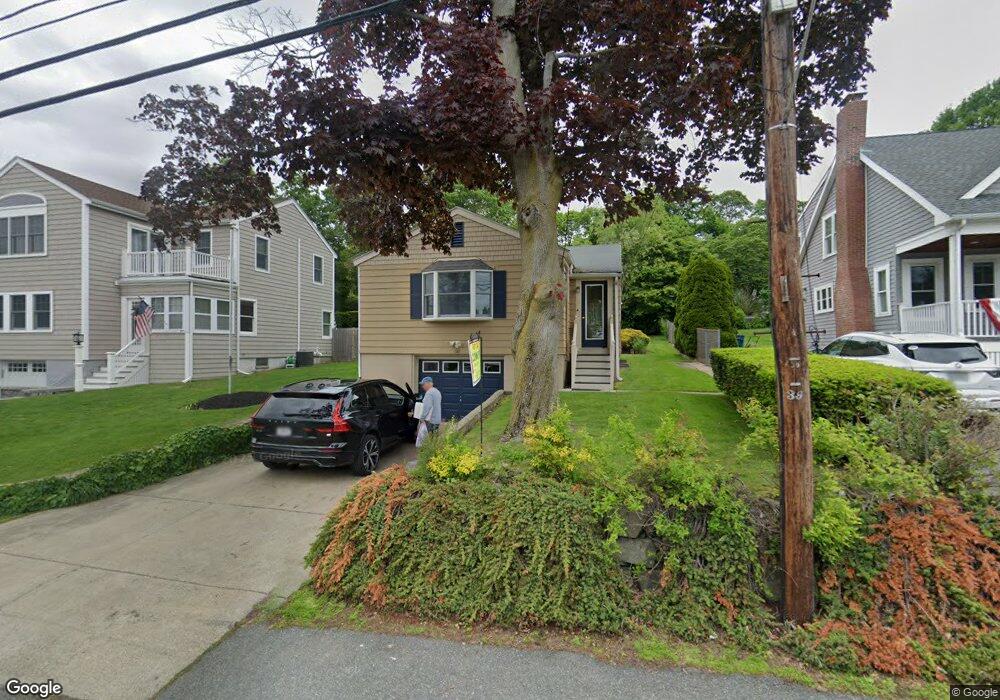
Are you looking to live by the Seashore in this One Floor Living 5 Room, 2 Bedrooms, 1.5 baths, Raised Ranch in Nahant with 1,068 sq ft of living space and sits on 6,490 sq ft of living space. Step right into the main floor with a sunlight living room with bow window and hardwood floors, a semi-modern eat-in-kitchen with dining area, 2 good sized bedrooms with hardwood floors and 1 full bath. The basement is unfinished with a laundry area and plenty of storage. There is a one-car garage under, small rear screened in porch with patio overlooking good-sized backyard. Just a perfect opportunity to live just steps to Short & Tudor Beaches, Kelley Green Golf Course, and enjoy the amenities with an ocean breeze. Move right into by summer! First Showing will be held at Open House on Sunday, March 15th from 12:00 - 1:30 p.m.
| Date | Buyer | Sale Price | Title Company |
|---|---|---|---|
| Desmarais Barbara L | $142,500 | -- | |
| Desmarais Barbara L | $142,500 | -- |
| Date | Status | Borrower | Loan Amount |
|---|---|---|---|
| Open | Desmarais Barbara L | $544,185 | |
| Closed | Desmarais Barbara L | $150,000 | |
| Closed | Desmarais Barbara L | $138,000 | |
| Closed | Desmarais Barbara L | $25,000 |
| Date | Event | Price | List to Sale | Price per Sq Ft |
|---|---|---|---|---|
| 04/03/2026 04/03/26 | Pending | -- | -- | -- |
| 03/11/2026 03/11/26 | For Sale | $649,000 | -- | $608 / Sq Ft |
| Year | Tax Paid | Tax Assessment Tax Assessment Total Assessment is a certain percentage of the fair market value that is determined by local assessors to be the total taxable value of land and additions on the property. | Land | Improvement |
|---|---|---|---|---|
| 2025 | $6,223 | $680,100 | $420,600 | $259,500 |
| 2024 | $6,006 | $662,200 | $402,700 | $259,500 |
| 2023 | $5,388 | $592,700 | $358,000 | $234,700 |
| 2022 | $5,146 | $525,600 | $304,300 | $221,300 |
| 2021 | $5,152 | $490,200 | $286,400 | $203,800 |
| 2020 | $4,855 | $442,600 | $268,500 | $174,100 |
| 2019 | $4,516 | $413,900 | $250,600 | $163,300 |
| 2018 | $4,174 | $407,200 | $250,600 | $156,600 |
| 2017 | $4,263 | $407,200 | $250,600 | $156,600 |
| 2016 | $3,883 | $369,100 | $219,300 | $149,800 |
| 2015 | $3,859 | $353,400 | $203,600 | $149,800 |
| 2014 | $3,696 | $335,100 | $185,300 | $149,800 |
Seller's Agent in 2026
Michael Connor
Connor Real Estate
(781) 581-5940
3 in this area
91 Total Sales
Ask me questions while you tour the home.