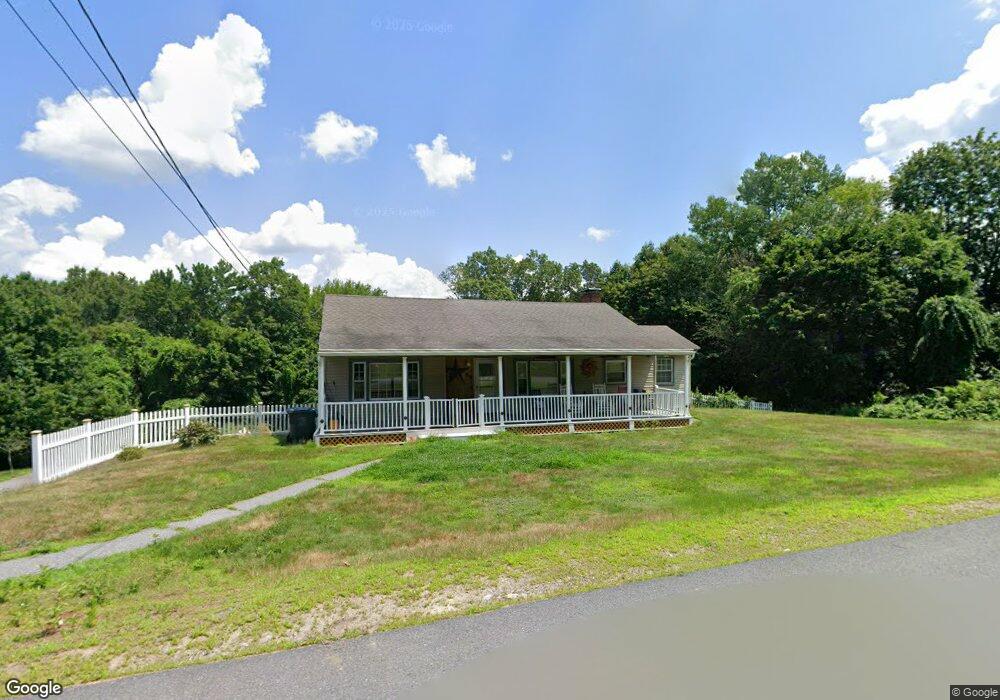
68 View St Dracut, MA 01826
Estimated Value: $493,000 - $584,000
About This Home
This home is located at 68 View St, Dracut, MA 01826 and is currently estimated at $543,916, approximately $421 per square foot. 68 View St is a home located in Middlesex County with nearby schools including Joseph A. Campbell Elementary School, Richardson Middle School, and Dracut Senior High School.
Ownership History
We collect this data history from publicly available records. To have your information removed, we recommend requesting removal directly through your county’s website.
Purchase Details
Home Financials for this Owner
Home Financials are based on the most recent Mortgage that was taken out on this home.Purchase Details
Home Values in the Area
Average Home Value in this Area
Purchase History
We collect this data history from publicly available records. To have your information removed, we recommend requesting removal directly through your county’s website.
| Date | Buyer | Sale Price | Title Company |
|---|---|---|---|
| $322,000 | -- | ||
| $100,000 | -- |
Mortgage History
We collect this data history from publicly available records. To have your information removed, we recommend requesting removal directly through your county’s website.
| Date | Status | Borrower | Loan Amount |
|---|---|---|---|
| Open | $319,476 | ||
| Previous Owner | $20,000 |
Tax History
We collect this data history from publicly available records. To have your information removed, we recommend requesting removal directly through your county’s website.
| Year | Tax Paid | Tax Assessment Tax Assessment Total Assessment is a certain percentage of the fair market value that is determined by local assessors to be the total taxable value of land and additions on the property. | Land | Improvement |
|---|---|---|---|---|
| 2025 | $4,606 | $455,100 | $205,500 | $249,600 |
| 2024 | $4,573 | $437,600 | $195,700 | $241,900 |
| 2023 | $4,519 | $390,200 | $170,200 | $220,000 |
| 2022 | $4,444 | $361,600 | $154,700 | $206,900 |
| 2021 | $4,289 | $329,700 | $140,500 | $189,200 |
| 2020 | $4,124 | $308,900 | $136,300 | $172,600 |
| 2019 | $4,027 | $292,900 | $129,800 | $163,100 |
| 2018 | $3,773 | $266,800 | $129,800 | $137,000 |
| 2017 | $3,661 | $266,800 | $129,800 | $137,000 |
| 2016 | $3,529 | $237,800 | $124,800 | $113,000 |
| 2015 | $3,426 | $229,500 | $124,800 | $104,700 |
| 2014 | $3,205 | $221,200 | $124,800 | $96,400 |
Map
- 71 Brook St
- Lot 11 Christian St
- Lot 12 Christian St
- Lot 9 Christian St
- Lot 10 Christian St
- 34 E 6th St
- 349 Beacon St Unit D
- 337 Beacon St
- 4 Hazelwood Ave Unit 12
- 4 Hazelwood Ave Unit 11
- 81 Reservoir St
- 144 Thissell Ave Unit 15
- Lots 1-12 Christian Hill Dev
- 15 Wildwood St Unit B19
- 185 18th St
- 96 Fremont St
- 82 Christian St
- 650 Robbins Ave Unit 39
- 52 Christian St
- 668 Robbins Ave Unit 3
Ask me questions while you tour the home.