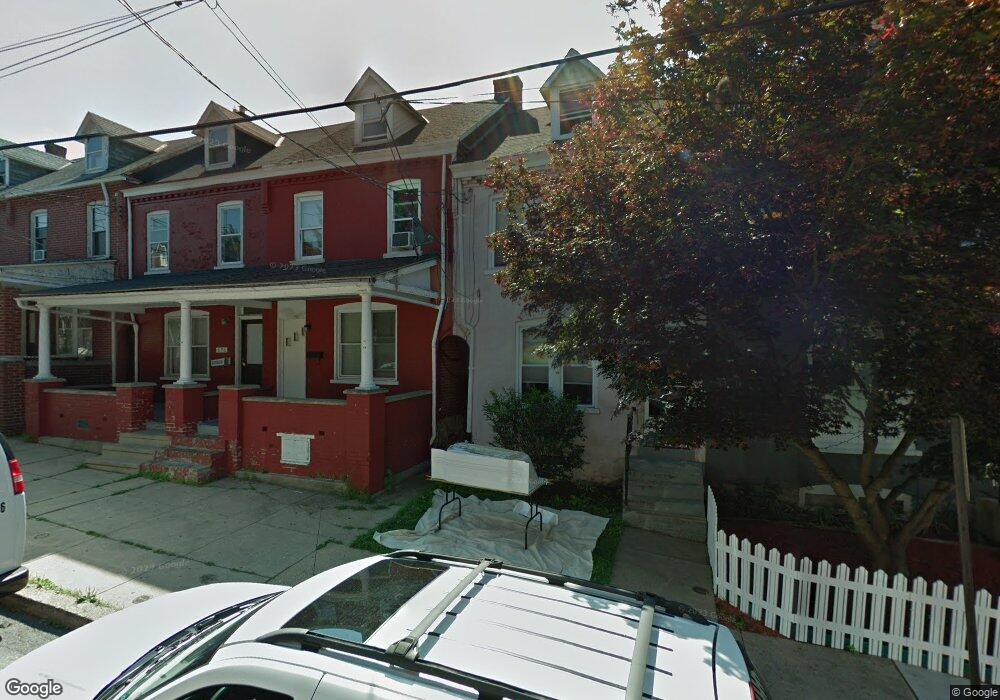
680 Hebrank St Lancaster, PA 17603
Cabbage Hill NeighborhoodEstimated Value: $148,000 - $179,000
2
Beds
1
Bath
1,030
Sq Ft
$160/Sq Ft
Est. Value
About This Home
This home is located at 680 Hebrank St, Lancaster, PA 17603 and is currently estimated at $165,274, approximately $160 per square foot. 680 Hebrank St is a home located in Lancaster County with nearby schools including Price Elementary School, Jackson Middle School, and McCaskey High School.
Ownership History
Date
Name
Owned For
Owner Type
Purchase Details
Closed on
Jul 27, 2016
Sold by
Woerner Barbara and Deutsche Bank National Trust C
Bought by
Bpy Properties Llc
Current Estimated Value
Purchase Details
Closed on
May 15, 2006
Sold by
Marquart Sherry L and Marquart Tony
Bought by
Woerner Barbara
Home Financials for this Owner
Home Financials are based on the most recent Mortgage that was taken out on this home.
Original Mortgage
$63,900
Interest Rate
6.4%
Mortgage Type
Fannie Mae Freddie Mac
Create a Home Valuation Report for This Property
The Home Valuation Report is an in-depth analysis detailing your home's value as well as a comparison with similar homes in the area
Home Values in the Area
Average Home Value in this Area
Purchase History
| Date | Buyer | Sale Price | Title Company |
|---|---|---|---|
| Bpy Properties Llc | $31,000 | None Available | |
| Woerner Barbara | $63,900 | None Available |
Source: Public Records
Mortgage History
| Date | Status | Borrower | Loan Amount |
|---|---|---|---|
| Previous Owner | Woerner Barbara | $63,900 |
Source: Public Records
Tax History
| Year | Tax Paid | Tax Assessment Tax Assessment Total Assessment is a certain percentage of the fair market value that is determined by local assessors to be the total taxable value of land and additions on the property. | Land | Improvement |
|---|---|---|---|---|
| 2025 | $1,951 | $49,300 | $12,800 | $36,500 |
| 2024 | $1,951 | $49,300 | $12,800 | $36,500 |
| 2023 | $1,918 | $49,300 | $12,800 | $36,500 |
| 2022 | $1,838 | $49,300 | $12,800 | $36,500 |
| 2021 | $1,799 | $49,300 | $12,800 | $36,500 |
| 2020 | $1,799 | $49,300 | $12,800 | $36,500 |
| 2019 | $1,772 | $49,300 | $12,800 | $36,500 |
| 2018 | $1,051 | $49,300 | $12,800 | $36,500 |
| 2017 | $2,733 | $59,500 | $14,900 | $44,600 |
| 2016 | $2,708 | $59,500 | $14,900 | $44,600 |
| 2015 | $1,056 | $59,500 | $14,900 | $44,600 |
| 2014 | $1,936 | $59,500 | $14,900 | $44,600 |
Source: Public Records
Map
Nearby Homes
- 327 Hazel St
- 240 Laurel St
- 841 Wabank St
- 679 Poplar St
- 662 Saint Joseph St
- 813 Fremont St
- 743 Saint Joseph St
- 826 Saint Joseph St
- 931 Rolridge Ave
- 529 Poplar St
- 643 Fairview Ave
- 428 S Prince St
- 638 High St
- 348 S Prince St
- 610 S Prince St
- 531 S Prince St
- 517 Saint Joseph St
- 751 High St
- 870 Hilton Dr
- 559 S Prince St
Your Personal Tour Guide
Ask me questions while you tour the home.