N
Seller's Agent in 2016
NON MEMBER
NON MEMBER OFFICE

Estimated Value: $306,000 - $552,000
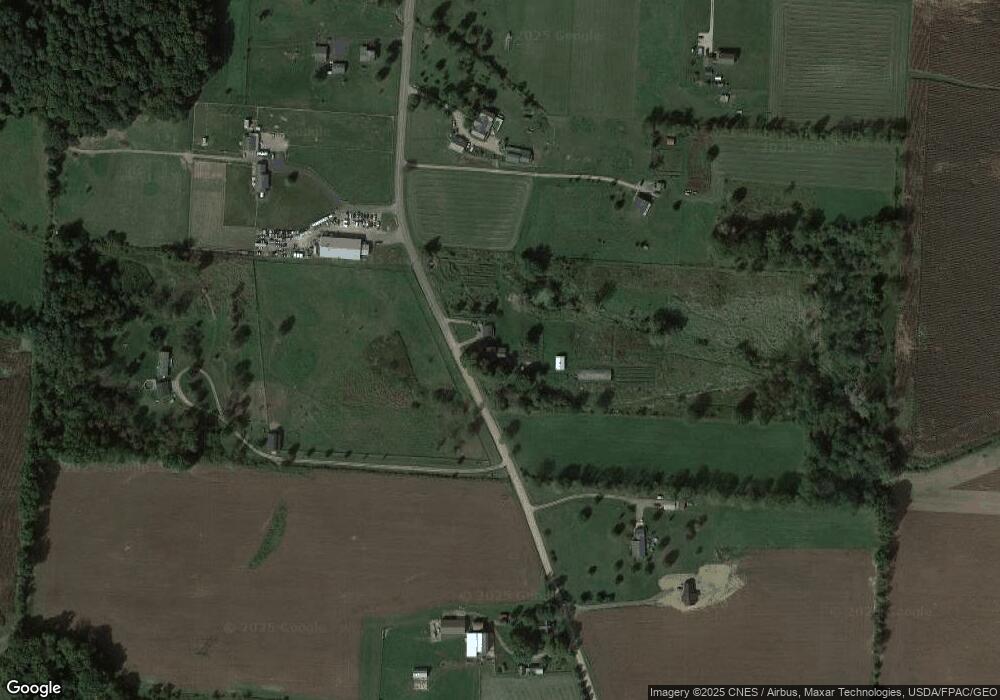
Rural Farm House
Last Agent to Sell the Property
NON MEMBER
NON MEMBER OFFICE Listed on: 05/25/2016
We collect this data history from publicly available records. To have your information removed, we recommend requesting removal directly through your county’s website.
We collect this data history from publicly available records. To have your information removed, we recommend requesting removal directly through your county’s website.
| Date | Buyer | Sale Price | Title Company |
|---|---|---|---|
| $121,500 | None Available | ||
| $99,000 | -- | ||
| $34,000 | -- |
We collect this data history from publicly available records. To have your information removed, we recommend requesting removal directly through your county’s website.
| Date | Status | Borrower | Loan Amount |
|---|---|---|---|
| Open | $128,000 |
We collect this data history from publicly available records. To have your information removed, we recommend requesting removal directly through your county’s website.
| Date | Event | Price | List to Sale | Price per Sq Ft | Prior Sale |
|---|---|---|---|---|---|
| 04/18/2014 04/18/14 | Sold | $162,000 | 0.0% | $54 / Sq Ft | |
| 04/18/2014 04/18/14 | For Sale | $162,000 | 0.0% | $54 / Sq Ft | |
| 04/16/2014 04/16/14 | Sold | $162,000 | -1.8% | $65 / Sq Ft | View Prior Sale |
| 03/18/2014 03/18/14 | Pending | -- | -- | -- | |
| 10/19/2013 10/19/13 | For Sale | $165,000 | -- | $67 / Sq Ft |
We collect this data history from publicly available records. To have your information removed, we recommend requesting removal directly through your county’s website.
| Year | Tax Paid | Tax Assessment Tax Assessment Total Assessment is a certain percentage of the fair market value that is determined by local assessors to be the total taxable value of land and additions on the property. | Land | Improvement |
|---|---|---|---|---|
| 2025 | $3,076 | $75,110 | $43,090 | $53,680 |
| 2024 | $3,076 | $96,770 | $43,090 | $53,680 |
| 2023 | $3,140 | $96,770 | $43,090 | $53,680 |
| 2022 | $2,404 | $75,010 | $33,400 | $41,610 |
| 2021 | $2,404 | $75,010 | $33,400 | $41,610 |
| 2020 | $2,344 | $75,010 | $33,400 | $41,610 |
| 2019 | $2,357 | $63,050 | $28,160 | $34,890 |
| 2018 | $2,359 | $63,050 | $28,160 | $34,890 |
| 2017 | $2,318 | $63,050 | $28,160 | $34,890 |
| 2016 | $2,270 | $54,830 | $24,490 | $30,340 |
| 2015 | $2,280 | $54,830 | $24,490 | $30,340 |
| 2014 | $2,268 | $54,830 | $24,490 | $30,340 |
| 2013 | $2,124 | $53,950 | $22,540 | $31,410 |
N
Seller's Agent in 2016
NON MEMBER
NON MEMBER OFFICE

Buyer's Agent in 2016
Jan Jedlinsky
Metro II Realty
(614) 348-3046
58 Total Sales
Seller's Agent in 2014
Robert Harrod
Re/Max Stars
(740) 507-4301
191 Total Sales
O
Buyer's Agent in 2014
OF OUT
OUT OF COUNTY NON MEMBER
Source: Columbus and Central Ohio Regional MLS
MLS Number: 216018112
APN: 44-00005.001
Disclaimer: Certain information contained herein is derived from information provided by parties other than Homes.com. All information provided is deemed reliable, but is not guaranteed to be accurate and should be independently verified.
![]() IDX information is provided exclusively for personal, non-commercial use, and may not be used for any purpose other than to identify prospective properties consumers may be interested in purchasing.
IDX information is provided exclusively for personal, non-commercial use, and may not be used for any purpose other than to identify prospective properties consumers may be interested in purchasing.
Information is deemed reliable but not guaranteed.
Ask me questions while you tour the home.