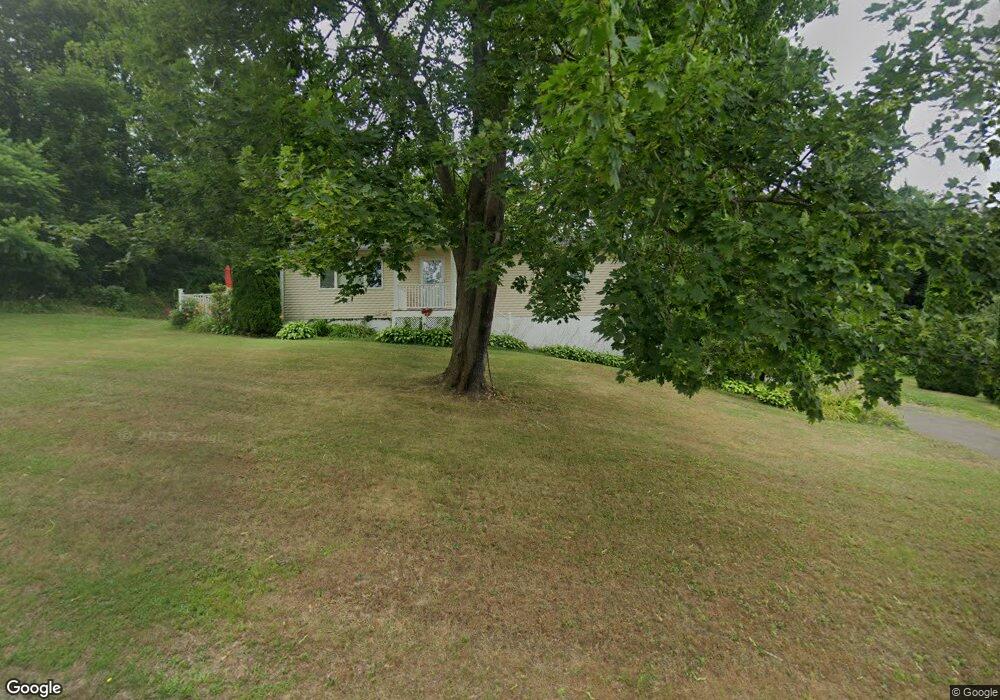
69 Apple Tree Ln Wallingford, CT 06492
Estimated Value: $456,374 - $517,000
3
Beds
2
Baths
1,242
Sq Ft
$388/Sq Ft
Est. Value
About This Home
This home is located at 69 Apple Tree Ln, Wallingford, CT 06492 and is currently estimated at $481,844, approximately $387 per square foot. 69 Apple Tree Ln is a home located in New Haven County with nearby schools including Evarts C. Stevens School, Parker Farms School, and James H. Moran Middle School.
Ownership History
Date
Name
Owned For
Owner Type
Purchase Details
Closed on
Dec 15, 2025
Sold by
Opuszynski Brandon and Pocius Lauren
Bought by
Bajaj Mansi and Merritt Walker E
Current Estimated Value
Purchase Details
Closed on
Apr 29, 1994
Sold by
Clapp Mark A
Bought by
Perry Anthony J and Perry L S
Create a Home Valuation Report for This Property
The Home Valuation Report is an in-depth analysis detailing your home's value as well as a comparison with similar homes in the area
Home Values in the Area
Average Home Value in this Area
Purchase History
| Date | Buyer | Sale Price | Title Company |
|---|---|---|---|
| Bajaj Mansi | $511,000 | -- | |
| Perry Anthony J | $135,000 | -- | |
| Perry Anthony J | $135,000 | -- |
Source: Public Records
Mortgage History
| Date | Status | Borrower | Loan Amount |
|---|---|---|---|
| Previous Owner | Perry Anthony J | $195,320 | |
| Previous Owner | Perry Anthony J | $195,320 | |
| Previous Owner | Perry Anthony J | $167,000 |
Source: Public Records
Tax History
| Year | Tax Paid | Tax Assessment Tax Assessment Total Assessment is a certain percentage of the fair market value that is determined by local assessors to be the total taxable value of land and additions on the property. | Land | Improvement |
|---|---|---|---|---|
| 2025 | $6,780 | $281,100 | $100,500 | $180,600 |
| 2024 | $5,899 | $192,400 | $83,100 | $109,300 |
| 2023 | $5,645 | $192,400 | $83,100 | $109,300 |
| 2022 | $5,587 | $192,400 | $83,100 | $109,300 |
| 2021 | $5,487 | $192,400 | $83,100 | $109,300 |
| 2020 | $5,038 | $172,600 | $81,300 | $91,300 |
| 2019 | $5,038 | $172,600 | $81,300 | $91,300 |
| 2018 | $4,943 | $172,600 | $81,300 | $91,300 |
| 2017 | $4,928 | $172,600 | $81,300 | $91,300 |
| 2016 | $4,814 | $172,600 | $81,300 | $91,300 |
| 2015 | $4,711 | $171,500 | $81,300 | $90,200 |
| 2014 | $4,612 | $171,500 | $81,300 | $90,200 |
Source: Public Records
Map
Nearby Homes
- 82 Spice Hill Dr Unit 82
- 2 Spice Hill Dr Unit 2
- 5 Cornwell Rd
- 96 Brentwood Dr
- 129 Brentwood Dr
- 5 Lost Brook Ln
- 36R Nod Brook Rd
- 230 Six Rod Hwy
- 31 S Turnpike Rd Unit C2
- 61 Cheshire Rd
- 1450 Mount Carmel Ave
- 30 Clinton Place
- 1350 Mount Carmel Ave
- 60 Chestnut Ln
- 69 Terrace Gardens
- 90 Masonic Ave
- 120 S Cherry St
- 54 Claremont Ave
- 39 Lincoln Ave
- 46 S Cherry St Unit 245
Your Personal Tour Guide
Ask me questions while you tour the home.