J
Seller's Agent in 2025
Julia Hupp
Red 1 Realty
(614) 531-0710
2 in this area
20 Total Sales

Estimated Value: $96,972 - $158,000
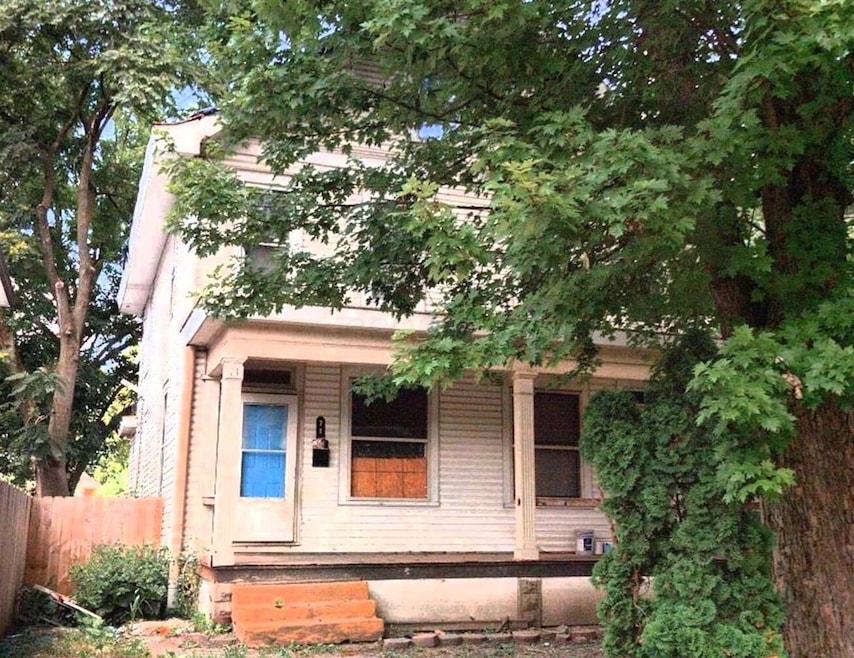
APPROVED SHORT SALE AT LIST PRICE!!! CONTINGENT UPON SHORT SALE APPROVAL!!!
4 bedrooms and 1 bath each side.
We collect this data history from publicly available records. To have your information removed, we recommend requesting removal directly through your county’s website.
| Date | Buyer | Sale Price | Title Company |
|---|---|---|---|
| Ohio Housing Authority Llc | $98,500 | Northwest Select Title | |
| Elious Frederick Desmond | -- | Northwest Select Title | |
| Elious Frederick Desmond | $130,000 | Pm Title Llc | |
| Limitless Reach Llc | -- | Bridge T&E Svcs Llc | |
| Bah Elhadj Souleymane | $90,000 | Bridge T&E Svcs Llc | |
| Tuthill Craig K | -- | Title First Agency Inc | |
| -- | $39,600 | -- |
We collect this data history from publicly available records. To have your information removed, we recommend requesting removal directly through your county’s website.
| Date | Status | Borrower | Loan Amount |
|---|---|---|---|
| Previous Owner | Elious Frederick Desmond | $127,645 | |
| Previous Owner | Bah Elhadj Souleymane | $88,369 |
| Date | Event | Price | List to Sale | Price per Sq Ft |
|---|---|---|---|---|
| 11/10/2025 11/10/25 | Sold | $98,500 | 0.0% | $47 / Sq Ft |
| 08/07/2025 08/07/25 | Price Changed | $98,500 | 0.0% | $47 / Sq Ft |
| 08/07/2025 08/07/25 | For Sale | $98,500 | +18.8% | $47 / Sq Ft |
| 04/24/2025 04/24/25 | Off Market | $82,900 | -- | -- |
| 03/09/2025 03/09/25 | For Sale | $82,900 | -- | $40 / Sq Ft |
| Year | Tax Paid | Tax Assessment Tax Assessment Total Assessment is a certain percentage of the fair market value that is determined by local assessors to be the total taxable value of land and additions on the property. | Land | Improvement |
|---|---|---|---|---|
| 2025 | $2,516 | $41,340 | $5,530 | $35,810 |
| 2024 | $2,516 | $41,340 | $5,530 | $35,810 |
| 2023 | $5,667 | $41,335 | $5,530 | $35,805 |
| 2022 | $1,965 | $25,060 | $2,730 | $22,330 |
| 2021 | $1,334 | $25,060 | $2,730 | $22,330 |
| 2020 | $1,336 | $25,060 | $2,730 | $22,330 |
| 2019 | $1,300 | $20,900 | $2,280 | $18,620 |
| 2018 | $1,211 | $20,900 | $2,280 | $18,620 |
| 2017 | $1,299 | $20,900 | $2,280 | $18,620 |
| 2016 | $1,236 | $18,200 | $5,180 | $13,020 |
| 2015 | $1,126 | $18,200 | $5,180 | $13,020 |
| 2014 | $1,128 | $18,200 | $5,180 | $13,020 |
| 2013 | $867 | $28,350 | $5,180 | $23,170 |
J
Seller's Agent in 2025
Julia Hupp
Red 1 Realty
(614) 531-0710
2 in this area
20 Total Sales

Buyer's Agent in 2025
Yuriy Boot
BUCH Realty, LLC
(614) 687-2711
5 in this area
129 Total Sales
Source: Columbus and Central Ohio Regional MLS
MLS Number: 225006985
APN: 010-015834
Disclaimer: Certain information contained herein is derived from information provided by parties other than Homes.com. All information provided is deemed reliable, but is not guaranteed to be accurate and should be independently verified.
![]() IDX information is provided exclusively for personal, non-commercial use, and may not be used for any purpose other than to identify prospective properties consumers may be interested in purchasing.
IDX information is provided exclusively for personal, non-commercial use, and may not be used for any purpose other than to identify prospective properties consumers may be interested in purchasing.
Information is deemed reliable but not guaranteed.
Ask me questions while you tour the home.