69 Cedar St Springfield, MA 01105
Maple-High Six Corners NeighborhoodEstimated Value: $216,053 - $335,000
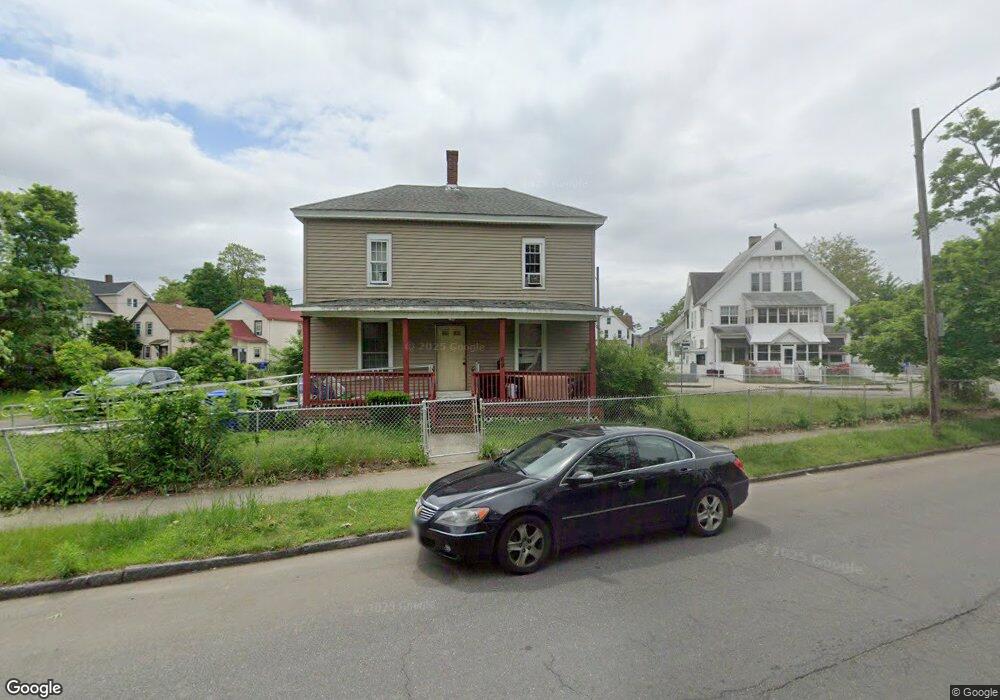
About This Home
This home is located at 69 Cedar St, Springfield, MA 01105 and is currently estimated at $248,763, approximately $175 per square foot. 69 Cedar St is a home located in Hampden County with nearby schools including Milton Bradley School, M Marcus Kiley Middle, and High School Of Commerce.
Ownership History
We collect this data history from publicly available records. To have your information removed, we recommend requesting removal directly through your county’s website.
Purchase Details
Home Financials for this Owner
Home Financials are based on the most recent Mortgage that was taken out on this home.Home Values in the Area
Average Home Value in this Area
Purchase History
We collect this data history from publicly available records. To have your information removed, we recommend requesting removal directly through your county’s website.
| Date | Buyer | Sale Price | Title Company |
|---|---|---|---|
| $50,000 | -- |
Mortgage History
We collect this data history from publicly available records. To have your information removed, we recommend requesting removal directly through your county’s website.
| Date | Status | Borrower | Loan Amount |
|---|---|---|---|
| Open | $48,212 |
Tax History
We collect this data history from publicly available records. To have your information removed, we recommend requesting removal directly through your county’s website.
| Year | Tax Paid | Tax Assessment Tax Assessment Total Assessment is a certain percentage of the fair market value that is determined by local assessors to be the total taxable value of land and additions on the property. | Land | Improvement |
|---|---|---|---|---|
| 2025 | $1,993 | $127,100 | $26,100 | $101,000 |
| 2024 | $1,916 | $119,300 | $24,400 | $94,900 |
| 2023 | $1,898 | $111,300 | $23,200 | $88,100 |
| 2022 | $1,651 | $87,700 | $21,100 | $66,600 |
| 2021 | $1,724 | $91,200 | $19,200 | $72,000 |
| 2020 | $1,662 | $85,100 | $19,200 | $65,900 |
| 2019 | $1,423 | $72,300 | $19,200 | $53,100 |
| 2018 | $1,515 | $77,000 | $19,200 | $57,800 |
| 2017 | $1,386 | $70,500 | $15,400 | $55,100 |
| 2016 | $1,256 | $63,900 | $15,400 | $48,500 |
| 2015 | $1,286 | $65,400 | $15,400 | $50,000 |
Map
- S/S aka 0 Brigham St
- 148-150 Cedar St
- 229 Central St
- 35-37 Pine Street Ct
- 48 Madison Ave
- 28-30 Crosby St
- 20 Crosby St
- WS Maple St
- SS Maple St
- 101 Mulberry St Unit G3
- 101 Mulberry St Unit 113
- 101 Mulberry St Unit 314
- 270 Maple St
- 120 Central St
- 69 Manhattan St
- 54 Ridgewood Place
- 27 Chester St
- 415 Maple St
- 157 Lebanon St
- 0 Allen St (Ss)
Ask me questions while you tour the home.