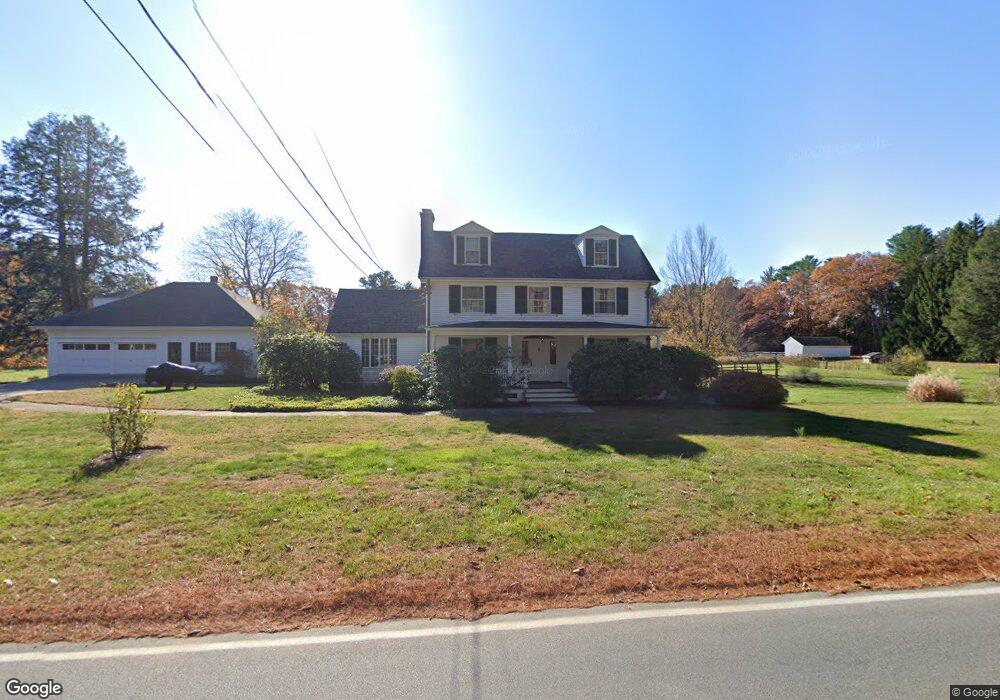
69 Cherry St Wenham, MA 01984
Estimated Value: $1,922,000 - $5,679,000
6
Beds
4
Baths
3,590
Sq Ft
$902/Sq Ft
Est. Value
About This Home
This home is located at 69 Cherry St, Wenham, MA 01984 and is currently estimated at $3,237,041, approximately $901 per square foot. 69 Cherry St is a home located in Essex County with nearby schools including Winthrop School, Bessie Buker Elementary School, and Cutler Elementary School.
Ownership History
Date
Name
Owned For
Owner Type
Purchase Details
Closed on
Dec 19, 2002
Sold by
Martins Dev Companies
Bought by
Martins Albert C and Martins Mary B
Current Estimated Value
Purchase Details
Closed on
May 1, 2001
Sold by
Est Jones Alice C and Jones Joseph A
Bought by
Martins Dev Co Inc
Create a Home Valuation Report for This Property
The Home Valuation Report is an in-depth analysis detailing your home's value as well as a comparison with similar homes in the area
Home Values in the Area
Average Home Value in this Area
Purchase History
| Date | Buyer | Sale Price | Title Company |
|---|---|---|---|
| Martins Albert C | $2,500,000 | -- | |
| Martins Dev Co Inc | $2,500,000 | -- |
Source: Public Records
Mortgage History
| Date | Status | Borrower | Loan Amount |
|---|---|---|---|
| Open | Martins Dev Co Inc | $150,000 | |
| Open | Martins Dev Co Inc | $2,780,000 |
Source: Public Records
Tax History
| Year | Tax Paid | Tax Assessment Tax Assessment Total Assessment is a certain percentage of the fair market value that is determined by local assessors to be the total taxable value of land and additions on the property. | Land | Improvement |
|---|---|---|---|---|
| 2025 | $25,313 | $1,628,921 | $588,821 | $1,040,100 |
| 2024 | $24,611 | $1,571,556 | $588,356 | $983,200 |
| 2023 | $30,081 | $1,733,800 | $746,200 | $987,600 |
| 2022 | $29,784 | $1,521,157 | $473,857 | $1,047,300 |
| 2021 | $29,221 | $1,484,807 | $437,507 | $1,047,300 |
| 2020 | $27,926 | $1,474,428 | $438,628 | $1,035,800 |
| 2019 | $26,571 | $1,474,528 | $438,728 | $1,035,800 |
| 2018 | $24,440 | $1,300,686 | $424,586 | $876,100 |
| 2017 | $23,193 | $1,265,286 | $424,586 | $840,700 |
| 2016 | $21,255 | $1,251,786 | $424,586 | $827,200 |
| 2015 | $20,342 | $1,251,786 | $424,586 | $827,200 |
Source: Public Records
Map
Nearby Homes
Your Personal Tour Guide
Ask me questions while you tour the home.