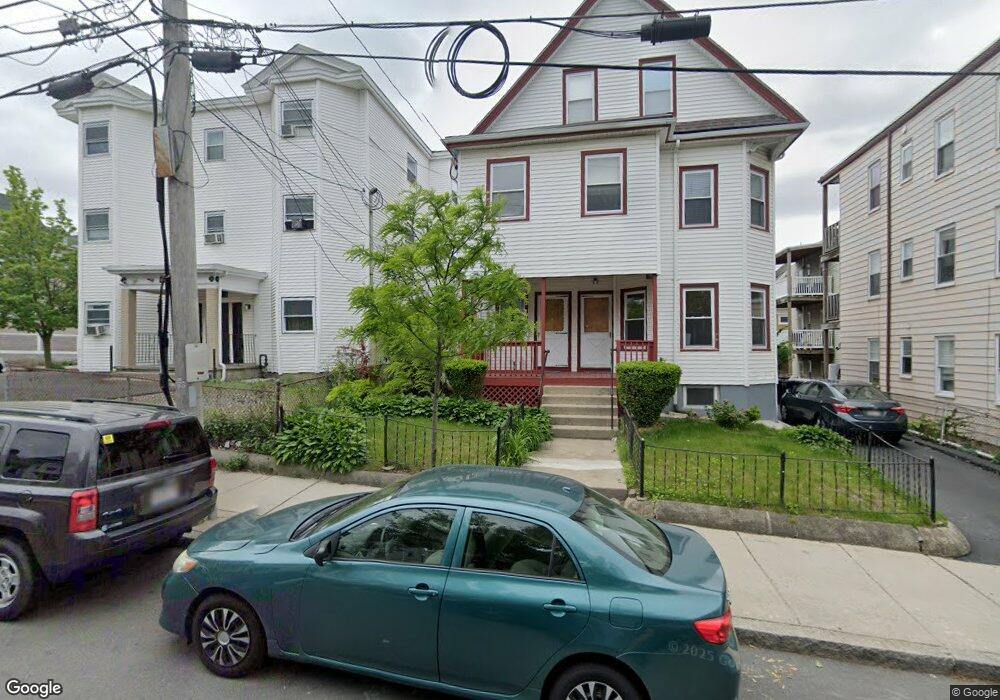
69 Chestnut St Everett, MA 02149
Glendale NeighborhoodEstimated Value: $824,044 - $949,000
About This Home
This home is located at 69 Chestnut St, Everett, MA 02149 and is currently estimated at $900,761, approximately $354 per square foot. 69 Chestnut St is a home located in Middlesex County with nearby schools including Everett High School, Pioneer Charter School of Science, and St Anthony School.
Ownership History
We collect this data history from publicly available records. To have your information removed, we recommend requesting removal directly through your county’s website.
Purchase Details
Home Financials for this Owner
Home Financials are based on the most recent Mortgage that was taken out on this home.Home Values in the Area
Average Home Value in this Area
Purchase History
We collect this data history from publicly available records. To have your information removed, we recommend requesting removal directly through your county’s website.
| Date | Buyer | Sale Price | Title Company |
|---|---|---|---|
| $95,000 | -- |
Mortgage History
We collect this data history from publicly available records. To have your information removed, we recommend requesting removal directly through your county’s website.
| Date | Status | Borrower | Loan Amount |
|---|---|---|---|
| Closed | $90,250 |
Tax History
We collect this data history from publicly available records. To have your information removed, we recommend requesting removal directly through your county’s website.
| Year | Tax Paid | Tax Assessment Tax Assessment Total Assessment is a certain percentage of the fair market value that is determined by local assessors to be the total taxable value of land and additions on the property. | Land | Improvement |
|---|---|---|---|---|
| 2025 | $8,700 | $763,800 | $259,200 | $504,600 |
| 2024 | $7,960 | $694,600 | $230,400 | $464,200 |
| 2023 | $7,651 | $649,500 | $211,200 | $438,300 |
| 2022 | $6,279 | $606,100 | $201,600 | $404,500 |
| 2021 | $5,617 | $569,100 | $180,500 | $388,600 |
| 2020 | $5,907 | $555,200 | $180,500 | $374,700 |
| 2019 | $6,256 | $505,300 | $171,800 | $333,500 |
| 2018 | $6,111 | $443,500 | $149,700 | $293,800 |
| 2017 | $5,522 | $382,400 | $115,200 | $267,200 |
| 2016 | $5,108 | $353,500 | $115,200 | $238,300 |
| 2015 | $4,846 | $331,700 | $108,200 | $223,500 |
Map
- 20 Raymond St
- 30 Waverly Ave
- 8 Parker St Unit 5
- 20 Derne St
- 8 Walnut St Unit 2
- 8 Walnut St Unit 28
- 6 Hampshire St
- 15 Marie Ave
- 96 Cleveland Ave
- 43-45 Shirley St
- 110 Ferry St
- 77 Swan St
- 24-26 Edith Ave
- 15 Dean St
- 826 Broadway
- 148 Florence St
- 30 Clarence St
- 859 Broadway Unit 15
- 159 Jefferson Ave
- 68 Linden St Unit 49
- 645 Broadway
- 63 Chestnut St
- 63 Chestnut St Unit 1
- 643 Broadway
- 641 Broadway
- 651 Broadway Unit 29
- 651 Broadway Unit 28
- 651 Broadway Unit 27
- 651 Broadway Unit 26
- 651 Broadway Unit 25
- 651 Broadway Unit 24
- 651 Broadway Unit 23
- 651 Broadway Unit 22
- 651 Broadway Unit 21
- 651 Broadway Unit 20
- 651 Broadway Unit 1A
- 651 Broadway Unit 19
- 651 Broadway Unit 18
- 651 Broadway Unit 17
- 651 Broadway Unit 16
Ask me questions while you tour the home.