Estimated Value: $119,000 - $159,000
3
Beds
2
Baths
1,456
Sq Ft
$95/Sq Ft
Est. Value
About This Home
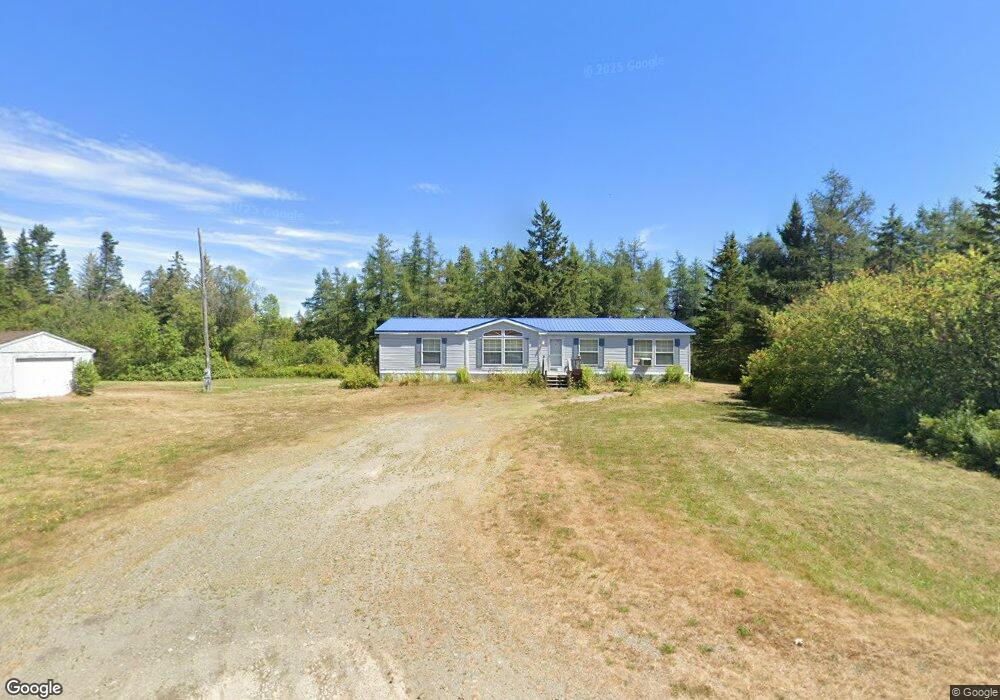
This home is located at 69 Crows Neck Rd, Lubec, ME 04652 and is currently estimated at $137,925, approximately $94 per square foot. 69 Crows Neck Rd is a home with nearby schools including Lubec Consolidated School.
Ownership History
Date
Name
Owned For
Owner Type
Purchase Details
Closed on
Oct 9, 2012
Sold by
Brown-Fuller April
Bought by
Brown Jesse W
Current Estimated Value
Create a Home Valuation Report for This Property
The Home Valuation Report is an in-depth analysis detailing your home's value as well as a comparison with similar homes in the area
Purchase History
| Date | Buyer | Sale Price | Title Company |
|---|---|---|---|
| Brown Jesse W | -- | -- |
Source: Public Records
Tax History
| Year | Tax Paid | Tax Assessment Tax Assessment Total Assessment is a certain percentage of the fair market value that is determined by local assessors to be the total taxable value of land and additions on the property. | Land | Improvement |
|---|---|---|---|---|
| 2024 | $1,799 | $94,700 | $23,100 | $71,600 |
| 2023 | $1,458 | $94,692 | $23,059 | $71,633 |
| 2022 | $1,655 | $68,363 | $9,959 | $58,404 |
| 2021 | $1,552 | $68,363 | $9,959 | $58,404 |
| 2020 | $1,554 | $68,363 | $9,959 | $58,404 |
| 2019 | $1,579 | $68,363 | $9,959 | $58,404 |
| 2018 | $1,565 | $68,363 | $9,959 | $58,404 |
| 2017 | $1,630 | $68,363 | $9,959 | $58,404 |
| 2016 | $1,579 | $68,363 | $9,959 | $58,404 |
| 2014 | $1,419 | $68,363 | $9,959 | $58,404 |
| 2013 | $1,333 | $68,363 | $9,959 | $58,404 |
Source: Public Records
Map
Nearby Homes
- 781 County Rd
- Lot 1-9 Lead Mine Rd
- 6 Case Dr
- 117 Denbow Rd
- 0 Map Wa032 Plan 01 Lot 103 1 Unit 1625755
- 0 Tideway Lane Lots 1 2 & 3 Unit 1643528
- 0 Lively Brook Rd Unit 1655270
- 14 Frog Ln
- WA032 01 4 Timber Cove Rd
- 01-4 Wa035
- 28.4 Wilcox Rd
- Lot 48 Coffins Neck Rd
- Lot 4 Julian Rd
- 269 County Rd
- 260 County Rd
- 1047 Boot Cove Rd
- 225 County Rd
- 69 Jims Head Rd
- L11/12/14 Boot Cove Rd
- Lot 25 H Boot Cove Rd
- 25 Crows Neck Rd
- xxx Route 189
- 74 Crows Neck Rd
- 55 Crows Neck Rd
- 50 Crows Neck Rd
- 51 Crows Neck Rd
- 44 Straight Bay Rd
- Lot 8 Lead Mine Rd
- 0 Lead Mine Rd Unit 1027459
- 0 Lead Mine Rd Unit 1027456
- 0 Lead Mine Rd Unit 1028044
- 0 Lead Mine Rd Unit 1054617
- 0 Lead Mine Rd Unit 1059113
- 13 Lead Mine Rd
- 13 Lead Mine Rd
- 21 Straight Bay Rd
- 45 Straight Bay Rd
- 25 Straight Bay Rd
- 38 Lead Mine Rd
- 27 Lead Mine Rd
Your Personal Tour Guide
Ask me questions while you tour the home.