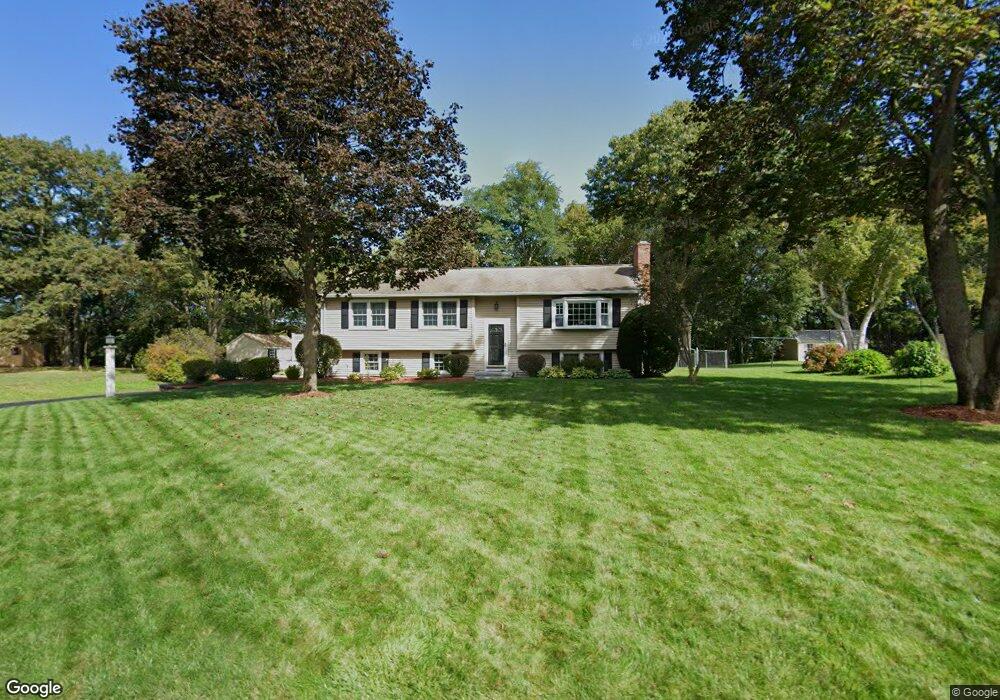
69 Ivy Dr Lancaster, MA 01523
Estimated Value: $464,000 - $562,000
3
Beds
1
Bath
1,250
Sq Ft
$421/Sq Ft
Est. Value
About This Home
This home is located at 69 Ivy Dr, Lancaster, MA 01523 and is currently estimated at $525,818, approximately $420 per square foot. 69 Ivy Dr is a home located in Worcester County with nearby schools including Mary Rowlandson Elementary School, Luther Burbank Middle School, and Nashoba Regional High School.
Ownership History
Date
Name
Owned For
Owner Type
Purchase Details
Closed on
Jul 16, 1996
Sold by
Thurston Bob W and Thurston Debra
Bought by
Poole James H and Poole Sheri
Current Estimated Value
Home Financials for this Owner
Home Financials are based on the most recent Mortgage that was taken out on this home.
Original Mortgage
$125,400
Interest Rate
7.98%
Mortgage Type
Purchase Money Mortgage
Create a Home Valuation Report for This Property
The Home Valuation Report is an in-depth analysis detailing your home's value as well as a comparison with similar homes in the area
Home Values in the Area
Average Home Value in this Area
Purchase History
| Date | Buyer | Sale Price | Title Company |
|---|---|---|---|
| Poole James H | $132,000 | -- |
Source: Public Records
Mortgage History
| Date | Status | Borrower | Loan Amount |
|---|---|---|---|
| Open | Poole James H | $165,000 | |
| Closed | Poole James H | $165,000 | |
| Closed | Poole James H | $125,400 | |
| Previous Owner | Poole James H | $40,000 |
Source: Public Records
Tax History
| Year | Tax Paid | Tax Assessment Tax Assessment Total Assessment is a certain percentage of the fair market value that is determined by local assessors to be the total taxable value of land and additions on the property. | Land | Improvement |
|---|---|---|---|---|
| 2025 | $7,784 | $481,700 | $121,900 | $359,800 |
| 2024 | $7,934 | $454,400 | $113,500 | $340,900 |
| 2023 | $7,596 | $441,900 | $103,100 | $338,800 |
| 2022 | $7,144 | $367,300 | $105,400 | $261,900 |
| 2021 | $6,797 | $340,200 | $105,400 | $234,800 |
| 2020 | $7,515 | $378,600 | $105,300 | $273,300 |
| 2019 | $6,593 | $333,800 | $105,300 | $228,500 |
| 2018 | $6,288 | $314,700 | $105,300 | $209,400 |
| 2016 | $5,793 | $296,300 | $104,300 | $192,000 |
| 2015 | $5,470 | $291,600 | $104,300 | $187,300 |
| 2014 | $5,234 | $276,800 | $104,300 | $172,500 |
Source: Public Records
Map
Nearby Homes
- 0 Parker Rd
- 113 Parker Rd Unit 1
- 300 Greeley St
- 0 Magnolia Ave
- 76 Mill St Unit 3
- 861 Main St
- 201-203 Stone St
- 201 Stone St Unit 203
- 73 Prescott St
- 54 S Meadow Rd
- 132 Kilbourn Rd
- 20 Willow St
- 229 Sterling St
- 508 High St
- 25 Greeley St Unit 2
- 51 Rigby St
- 719 Main St
- 57 Clark St
- 55 Sterling St Unit 306
- 55 Sterling St Unit 312
Your Personal Tour Guide
Ask me questions while you tour the home.