Estimated Value: $262,933 - $658,000
Studio
--
Bath
--
Sq Ft
15,682
Sq Ft Lot
About This Home
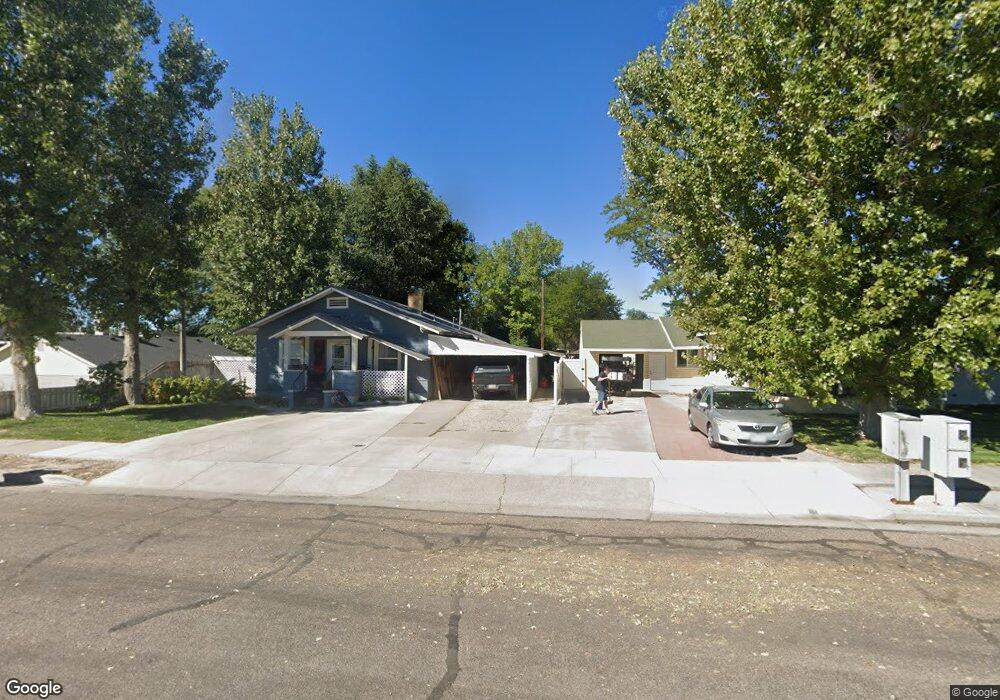
This home is located at 69 N 200 W, Delta, UT 84624 and is currently estimated at $382,733. 69 N 200 W is a home with nearby schools including Cba Center and White River Academy.
Ownership History
Date
Name
Owned For
Owner Type
Purchase Details
Closed on
Sep 17, 2018
Sold by
Eggleston John Edward
Bought by
Eggleston John Edward and Eggleston Summer Maree
Current Estimated Value
Purchase Details
Closed on
Jul 25, 2008
Sold by
Anderson Margene
Bought by
Finlinson Julian E and Finlinson Lisa O
Home Financials for this Owner
Home Financials are based on the most recent Mortgage that was taken out on this home.
Original Mortgage
$130,000
Interest Rate
6.42%
Create a Home Valuation Report for This Property
The Home Valuation Report is an in-depth analysis detailing your home's value as well as a comparison with similar homes in the area
Home Values in the Area
Average Home Value in this Area
Purchase History
| Date | Buyer | Sale Price | Title Company |
|---|---|---|---|
| Eggleston John Edward | -- | First American Title | |
| Eggleston John Edward | -- | -- | |
| Finlinson Julian E | -- | -- |
Source: Public Records
Mortgage History
| Date | Status | Borrower | Loan Amount |
|---|---|---|---|
| Previous Owner | Finlinson Julian E | $130,000 |
Source: Public Records
Tax History
| Year | Tax Paid | Tax Assessment Tax Assessment Total Assessment is a certain percentage of the fair market value that is determined by local assessors to be the total taxable value of land and additions on the property. | Land | Improvement |
|---|---|---|---|---|
| 2025 | $3 | $163,877 | $18,387 | $145,490 |
| 2024 | $131,480 | $131,480 | $13,141 | $118,339 |
| 2023 | $1,620 | $131,480 | $13,141 | $118,339 |
| 2022 | $2 | $95,470 | $13,738 | $81,732 |
| 2021 | $2 | $77,108 | $10,388 | $66,720 |
| 2020 | $2 | $71,299 | $9,444 | $61,855 |
| 2019 | $2 | $67,478 | $8,744 | $58,734 |
| 2018 | $870 | $62,629 | $8,744 | $53,885 |
| 2017 | $900 | $62,374 | $8,489 | $53,885 |
| 2016 | $871 | $62,374 | $8,489 | $53,885 |
| 2015 | $871 | $62,374 | $8,489 | $53,885 |
| 2014 | -- | $59,192 | $8,489 | $50,703 |
| 2013 | -- | $59,192 | $8,489 | $50,703 |
Source: Public Records
Map
Nearby Homes
- 149 N 200 W
- 345 W 100 North Rd
- 163 W 100 S
- 341 W 100 S
- 325 N 100 W
- 435 W 100 S
- 320 N 450 W
- 334 N 450 W
- 294 S 300 W
- 225 E Main St
- 87 S 300 East Rd
- 321 E 200 S
- 445 Topaz Blvd Unit 10
- 520 E 450 North Rd
- 98 W 1000 N
- 648 Tamarix St
- 901 E 750 Rd N
- Locust Ave Unit LotWP001
- 1500 E 500 South Rd
- 2595 E 500 Rd S Unit 3
Your Personal Tour Guide
Ask me questions while you tour the home.