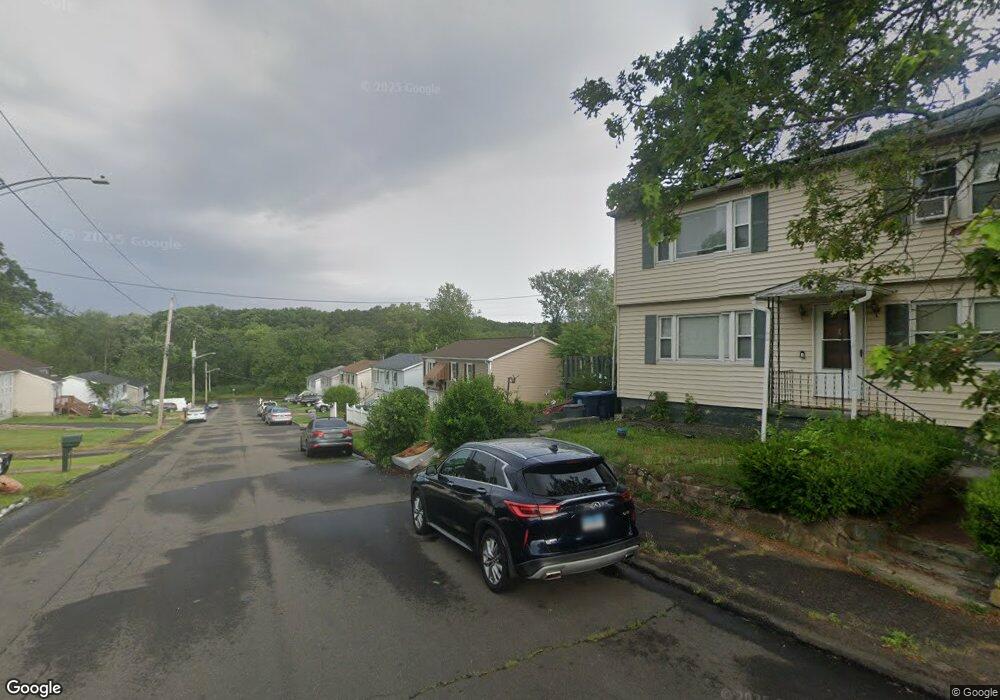
69 Norwell St West Haven, CT 06516
Allingtown NeighborhoodEstimated Value: $359,000 - $407,784
About This Home
This home is located at 69 Norwell St, West Haven, CT 06516 and is currently estimated at $382,696, approximately $344 per square foot. 69 Norwell St is a home located in New Haven County with nearby schools including Carrigan 5/6 Intermediate School, Harry M. Bailey Middle School, and West Haven High School.
Ownership History
We collect this data history from publicly available records. To have your information removed, we recommend requesting removal directly through your county’s website.
Purchase Details
Home Financials for this Owner
Home Financials are based on the most recent Mortgage that was taken out on this home.Purchase Details
Purchase Details
Home Values in the Area
Average Home Value in this Area
Purchase History
We collect this data history from publicly available records. To have your information removed, we recommend requesting removal directly through your county’s website.
| Date | Buyer | Sale Price | Title Company |
|---|---|---|---|
| $165,000 | -- | ||
| $99,000 | -- | ||
| $93,000 | -- | ||
| $165,000 | -- | ||
| $99,000 | -- | ||
| $93,000 | -- |
Mortgage History
We collect this data history from publicly available records. To have your information removed, we recommend requesting removal directly through your county’s website.
| Date | Status | Borrower | Loan Amount |
|---|---|---|---|
| Open | $132,000 | ||
| Closed | $132,000 | ||
| Previous Owner | $112,140 |
Tax History
We collect this data history from publicly available records. To have your information removed, we recommend requesting removal directly through your county’s website.
| Year | Tax Paid | Tax Assessment Tax Assessment Total Assessment is a certain percentage of the fair market value that is determined by local assessors to be the total taxable value of land and additions on the property. | Land | Improvement |
|---|---|---|---|---|
| 2025 | $7,997 | $235,130 | $60,620 | $174,510 |
| 2024 | $7,063 | $147,490 | $42,000 | $105,490 |
| 2023 | $6,846 | $147,490 | $42,000 | $105,490 |
| 2022 | $6,727 | $147,490 | $42,000 | $105,490 |
| 2021 | $6,728 | $147,490 | $42,000 | $105,490 |
| 2020 | $6,521 | $126,630 | $34,090 | $92,540 |
| 2019 | $6,420 | $126,630 | $34,090 | $92,540 |
| 2018 | $6,245 | $126,630 | $34,090 | $92,540 |
| 2017 | $6,050 | $126,630 | $34,090 | $92,540 |
| 2016 | $5,867 | $126,630 | $34,090 | $92,540 |
| 2015 | $5,420 | $133,210 | $36,610 | $96,600 |
| 2014 | $5,312 | $133,210 | $36,610 | $96,600 |
Map
- 127 Rangely St
- 8 Norwell St
- 320 Fairfax St
- 50 Ashford St
- 48 Trescott St
- 96 Enright St
- 75 Wenham St
- 60 Plainfield Ave Unit 16
- 32 Ogden St
- 46 Ogden St
- 548 Howellton Rd
- 61 Hillside St
- 45 Daytona St
- 54 Forest Hills Rd
- 42 Wade St
- 11 Tampa St
- 7 Ipswich St
- 11 Priscilla Rd
- 622 Chestnut Ridge Rd
- 229 Homeside Ave
Ask me questions while you tour the home.