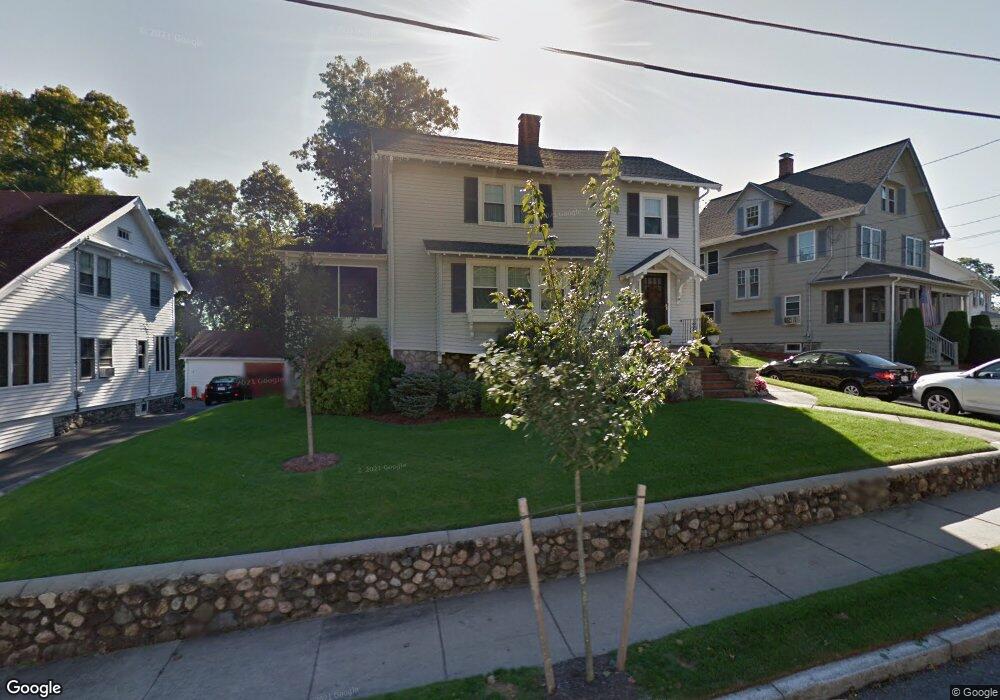
69 Nowell Rd Melrose, MA 02176
Melrose Highlands NeighborhoodEstimated Value: $902,000 - $1,039,000
About This Home
This home is located at 69 Nowell Rd, Melrose, MA 02176 and is currently estimated at $966,010, approximately $581 per square foot. 69 Nowell Rd is a home located in Middlesex County with nearby schools including Horace Mann Elementary School, Roosevelt Elementary School, and Winthrop Elementary School.
Ownership History
We collect this data history from publicly available records. To have your information removed, we recommend requesting removal directly through your county’s website.
Purchase Details
Home Values in the Area
Average Home Value in this Area
Purchase History
We collect this data history from publicly available records. To have your information removed, we recommend requesting removal directly through your county’s website.
| Date | Buyer | Sale Price | Title Company |
|---|---|---|---|
| $75,000 | -- |
Mortgage History
We collect this data history from publicly available records. To have your information removed, we recommend requesting removal directly through your county’s website.
| Date | Status | Borrower | Loan Amount |
|---|---|---|---|
| Open | $89,000 | ||
| Closed | $99,000 | ||
| Closed | $25,000 | ||
| Closed | $110,000 |
Tax History
We collect this data history from publicly available records. To have your information removed, we recommend requesting removal directly through your county’s website.
| Year | Tax Paid | Tax Assessment Tax Assessment Total Assessment is a certain percentage of the fair market value that is determined by local assessors to be the total taxable value of land and additions on the property. | Land | Improvement |
|---|---|---|---|---|
| 2025 | $78 | $790,500 | $512,700 | $277,800 |
| 2024 | $7,850 | $790,500 | $512,700 | $277,800 |
| 2023 | $7,416 | $711,700 | $457,300 | $254,400 |
| 2022 | $7,127 | $674,300 | $429,600 | $244,700 |
| 2021 | $6,805 | $621,500 | $388,000 | $233,500 |
| 2020 | $6,869 | $621,600 | $388,000 | $233,600 |
| 2019 | $6,107 | $564,900 | $350,600 | $214,300 |
| 2018 | $6,039 | $533,000 | $318,700 | $214,300 |
| 2017 | $5,937 | $503,100 | $304,900 | $198,200 |
| 2016 | $5,822 | $472,200 | $291,000 | $181,200 |
| 2015 | $5,606 | $432,600 | $277,100 | $155,500 |
| 2014 | $5,562 | $418,800 | $263,300 | $155,500 |
Map
- 16 Ells Ave
- 601 Franklin St Unit 2
- 585 Franklin St Unit 6
- 629 Franklin St
- 43-51 Albion St Unit C9
- 51 Melrose St Unit 2D
- 51 Melrose St Unit 1A
- 18 Hanson St
- 53 Melrose St Unit 6F
- 53 Melrose St Unit 2B
- 53 Melrose St Unit 3B
- 53 Melrose St Unit 5H
- 49 Melrose St Unit 4B
- 180 Green St Unit 101
- 33 Brunswick Park Unit 2
- 8 Linden Rd Unit 1
- 8 Linden Rd
- 6 Findlay St
- 26 Garden St
- 9 Mendum St
Ask me questions while you tour the home.