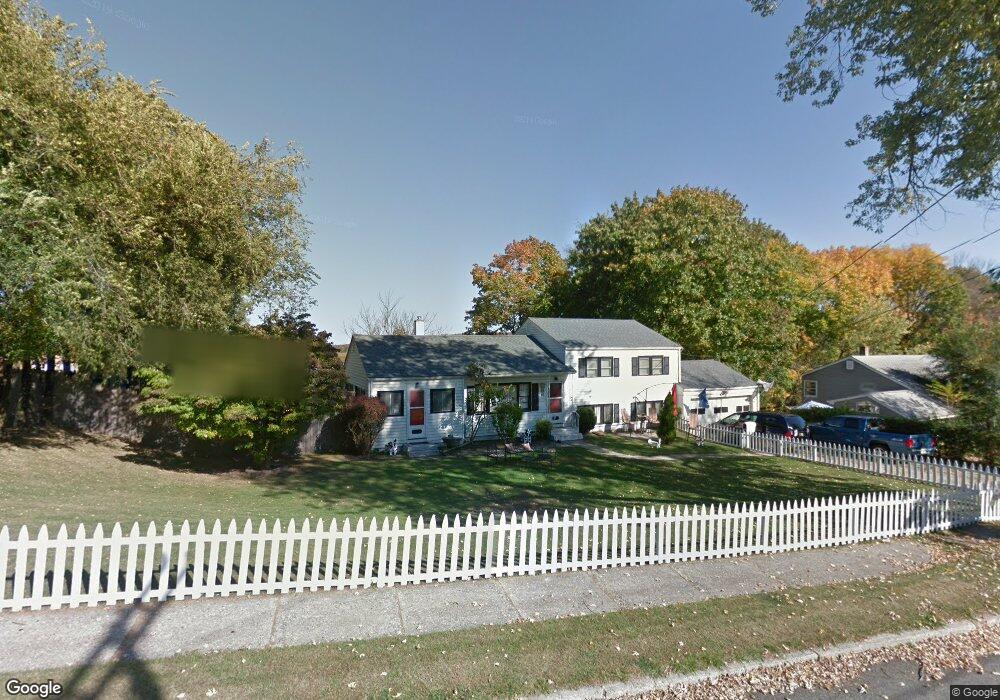
69 Pine St Newton, NJ 07860
Estimated Value: $466,199 - $520,000
Studio
--
Bath
2,106
Sq Ft
$235/Sq Ft
Est. Value
About This Home
This home is located at 69 Pine St, Newton, NJ 07860 and is currently estimated at $494,550, approximately $234 per square foot. 69 Pine St is a home located in Sussex County with nearby schools including Merriam Avenue School, Halsted Street Middle School, and Newton High School.
Ownership History
Date
Name
Owned For
Owner Type
Purchase Details
Closed on
May 5, 2010
Sold by
Smith Robert T and Smith Patricia J
Bought by
Ream Clark M and Ream Joann
Current Estimated Value
Home Financials for this Owner
Home Financials are based on the most recent Mortgage that was taken out on this home.
Original Mortgage
$226,773
Outstanding Balance
$152,517
Interest Rate
5.12%
Mortgage Type
VA
Estimated Equity
$342,033
Purchase Details
Closed on
Jul 11, 1995
Sold by
Richard Donald and Richard Abraham
Bought by
Smith Robert T and Smith Patricia J
Create a Home Valuation Report for This Property
The Home Valuation Report is an in-depth analysis detailing your home's value as well as a comparison with similar homes in the area
Home Values in the Area
Average Home Value in this Area
Purchase History
| Date | Buyer | Sale Price | Title Company |
|---|---|---|---|
| Ream Clark M | $222,000 | New Jersey Title Ins Company | |
| Smith Robert T | $145,000 | -- |
Source: Public Records
Mortgage History
| Date | Status | Borrower | Loan Amount |
|---|---|---|---|
| Open | Ream Clark M | $226,773 |
Source: Public Records
Tax History
| Year | Tax Paid | Tax Assessment Tax Assessment Total Assessment is a certain percentage of the fair market value that is determined by local assessors to be the total taxable value of land and additions on the property. | Land | Improvement |
|---|---|---|---|---|
| 2025 | $10,365 | $408,800 | $125,800 | $283,000 |
| 2024 | $10,831 | $380,100 | $101,500 | $278,600 |
Source: Public Records
Map
Nearby Homes
Your Personal Tour Guide
Ask me questions while you tour the home.