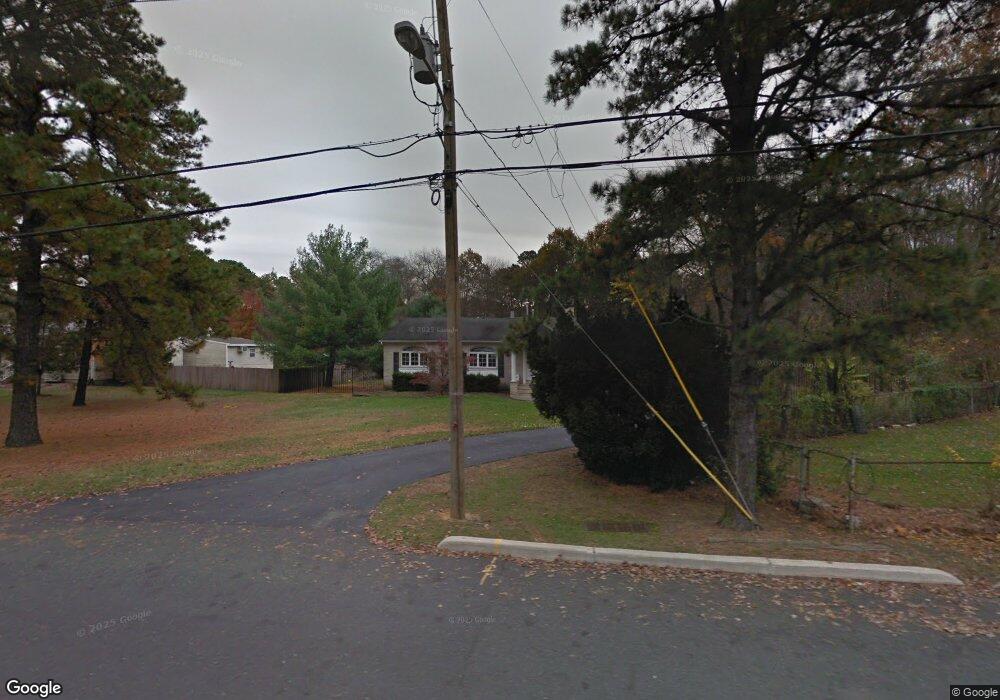
69 Pine St Old Bridge, NJ 08857
Estimated Value: $600,569 - $689,000
Studio
--
Bath
1,852
Sq Ft
$352/Sq Ft
Est. Value
About This Home
This home is located at 69 Pine St, Old Bridge, NJ 08857 and is currently estimated at $651,142, approximately $351 per square foot. 69 Pine St is a home located in Middlesex County with nearby schools including Old Bridge High School and St. Thomas the Apostle School.
Ownership History
Date
Name
Owned For
Owner Type
Purchase Details
Closed on
Jan 7, 2026
Sold by
Corbin Denise M
Bought by
Dcc Pine Living Trust and Corbin
Current Estimated Value
Purchase Details
Closed on
Jul 18, 2008
Sold by
Corbin Richard
Bought by
Corbin Denise M
Create a Home Valuation Report for This Property
The Home Valuation Report is an in-depth analysis detailing your home's value as well as a comparison with similar homes in the area
Home Values in the Area
Average Home Value in this Area
Purchase History
| Date | Buyer | Sale Price | Title Company |
|---|---|---|---|
| Dcc Pine Living Trust | -- | None Listed On Document | |
| Corbin Denise M | -- | None Available |
Source: Public Records
Tax History
| Year | Tax Paid | Tax Assessment Tax Assessment Total Assessment is a certain percentage of the fair market value that is determined by local assessors to be the total taxable value of land and additions on the property. | Land | Improvement |
|---|---|---|---|---|
| 2025 | $10,023 | $177,500 | $71,500 | $106,000 |
| 2024 | $9,615 | $177,500 | $71,500 | $106,000 |
| 2023 | $9,615 | $177,500 | $71,500 | $106,000 |
| 2022 | $9,395 | $177,500 | $71,500 | $106,000 |
| 2021 | $6,895 | $177,500 | $71,500 | $106,000 |
| 2020 | $9,118 | $177,500 | $71,500 | $106,000 |
| 2019 | $8,964 | $177,500 | $71,500 | $106,000 |
| 2018 | $8,864 | $177,500 | $71,500 | $106,000 |
| 2017 | $8,577 | $177,500 | $71,500 | $106,000 |
| 2016 | $8,399 | $177,500 | $71,500 | $106,000 |
| 2015 | $8,254 | $177,500 | $71,500 | $106,000 |
| 2014 | $8,170 | $177,500 | $71,500 | $106,000 |
Source: Public Records
Map
Nearby Homes
- 30 Arvin Rd
- 21 Pine St
- 98 Madison Ave
- 82 Madison Ave
- 1212 Englishtown Rd
- 35 Birch St
- 14 Andover Rd
- 1283 Englishtown Rd
- 1210 Englishtown Rd
- 14 Brookside Ave
- 1299 Englishtown Rd
- 1122 Marlboro Rd
- 34 Brookside Ave
- 5 Dan Ct
- 23 Orchard Dr
- 268 Austin Ave
- 132 Southwood Dr
- 41 Brookside Dr Ave
- 41 Brookside Ave
- 24 Kensington Ave
Your Personal Tour Guide
Ask me questions while you tour the home.