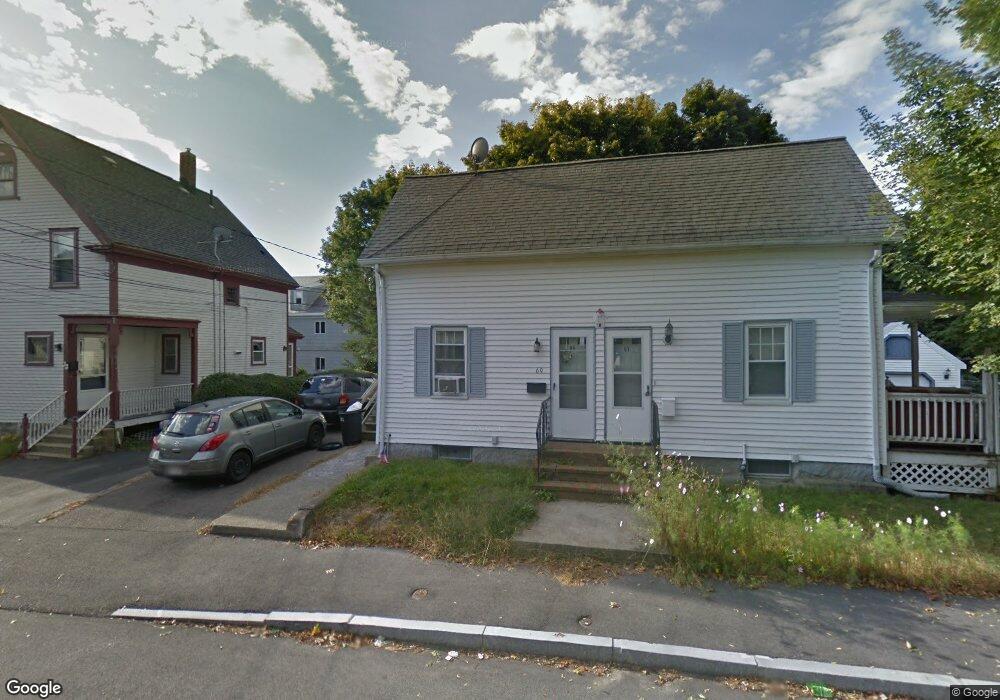
69 S Walnut St Quincy, MA 02169
Quincy Point NeighborhoodEstimated Value: $485,632 - $528,000
3
Beds
1
Bath
875
Sq Ft
$584/Sq Ft
Est. Value
About This Home
This home is located at 69 S Walnut St, Quincy, MA 02169 and is currently estimated at $511,408, approximately $584 per square foot. 69 S Walnut St is a home located in Norfolk County with nearby schools including Point Webster Middle School, Clifford H. Marshall Elementary School, and Quincy High School.
Ownership History
Date
Name
Owned For
Owner Type
Purchase Details
Closed on
Jul 23, 2004
Sold by
Bb & P Rt
Bought by
Tashjian Judith M
Current Estimated Value
Home Financials for this Owner
Home Financials are based on the most recent Mortgage that was taken out on this home.
Original Mortgage
$91,600
Outstanding Balance
$45,616
Interest Rate
6.28%
Mortgage Type
Purchase Money Mortgage
Estimated Equity
$465,792
Purchase Details
Closed on
Jan 16, 2004
Sold by
Cusick Barbara and Lundberg Allen
Bought by
Bb & P Rt
Create a Home Valuation Report for This Property
The Home Valuation Report is an in-depth analysis detailing your home's value as well as a comparison with similar homes in the area
Home Values in the Area
Average Home Value in this Area
Purchase History
We collect this data history from publicly available records. To have your information removed, we recommend requesting removal directly through your county’s website.
| Date | Buyer | Sale Price | Title Company |
|---|---|---|---|
| Tashjian Judith M | $267,500 | -- | |
| Bb & P Rt | $165,000 | -- |
Source: Public Records
Mortgage History
We collect this data history from publicly available records. To have your information removed, we recommend requesting removal directly through your county’s website.
| Date | Status | Borrower | Loan Amount |
|---|---|---|---|
| Open | Tashjian Judith M | $91,600 |
Source: Public Records
Tax History
| Year | Tax Paid | Tax Assessment Tax Assessment Total Assessment is a certain percentage of the fair market value that is determined by local assessors to be the total taxable value of land and additions on the property. | Land | Improvement |
|---|---|---|---|---|
| 2025 | $5,157 | $447,300 | $237,200 | $210,100 |
| 2024 | $4,825 | $428,100 | $225,900 | $202,200 |
| 2023 | $4,417 | $396,900 | $205,300 | $191,600 |
| 2022 | $4,380 | $365,600 | $186,700 | $178,900 |
| 2021 | $4,194 | $345,500 | $186,700 | $158,800 |
| 2020 | $3,863 | $310,800 | $176,100 | $134,700 |
| 2019 | $3,710 | $295,600 | $163,100 | $132,500 |
| 2018 | $3,356 | $251,600 | $148,200 | $103,400 |
| 2017 | $3,357 | $236,900 | $141,200 | $95,700 |
| 2016 | $3,148 | $219,200 | $128,300 | $90,900 |
| 2015 | $2,980 | $204,100 | $121,100 | $83,000 |
| 2014 | $2,917 | $196,300 | $121,100 | $75,200 |
Source: Public Records
Map
Nearby Homes
- 113 Elm St Unit D
- 123 Elm St Unit C-2
- 44 Elm St
- 15 Grafton St
- 39-47 Water St
- 99 Sumner St Unit 2
- 99 Sumner St Unit 1
- 168 Main St
- 101 Sumner St Unit 2
- 101 Sumner St Unit 1
- 2 Cliveden St Unit 601E
- 2 Cliveden St Unit 405E
- 158 Sumner St Unit 1
- 66 Mcgrath Hwy Unit 403
- 66 Mcgrath Hwy Unit 409
- 66 Mcgrath Hwy Unit 301
- 66 Mcgrath Hwy Unit 204
- 161 Sumner St Unit 2
- 30 Arnold St
- 59 Spear St Unit 301
- 22 Atherton St
- 16 Atherton St
- 26 Atherton St
- 18 Atherton St
- 18-20 Atherton St Unit 20
- 30 Atherton St
- 30 Atherton St Unit 1
- 12 Atherton St
- 62 South St Unit 9
- 62 South St Unit 8
- 62 South St Unit 6
- 62 South St Unit 5
- 62 South St Unit 4
- 62 South St Unit 3
- 62 South St Unit 20
- 62 South St Unit 2
- 62 South St Unit 1A
- 62 South St Unit 19
- 62 South St Unit 18
- 62 South St Unit 17
Your Personal Tour Guide
Ask me questions while you tour the home.