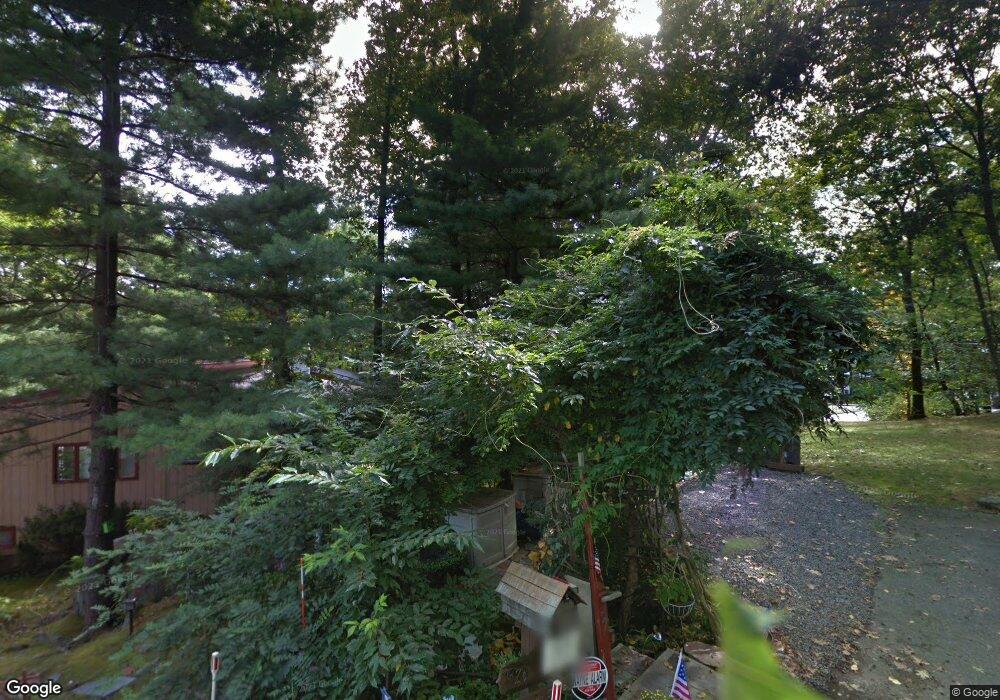
69 Sargent Rd Swampscott, MA 01907
Estimated Value: $745,000 - $779,000
About This Home
This home is located at 69 Sargent Rd, Swampscott, MA 01907 and is currently estimated at $765,012, approximately $559 per square foot. 69 Sargent Rd is a home located in Essex County with nearby schools including Swampscott Middle School and Swampscott High School.
Ownership History
We collect this data history from publicly available records. To have your information removed, we recommend requesting removal directly through your county’s website.
Purchase Details
Home Financials for this Owner
Home Financials are based on the most recent Mortgage that was taken out on this home.Home Values in the Area
Average Home Value in this Area
Purchase History
We collect this data history from publicly available records. To have your information removed, we recommend requesting removal directly through your county’s website.
| Date | Buyer | Sale Price | Title Company |
|---|---|---|---|
| $390,000 | -- | ||
| $390,000 | -- |
Mortgage History
We collect this data history from publicly available records. To have your information removed, we recommend requesting removal directly through your county’s website.
| Date | Status | Borrower | Loan Amount |
|---|---|---|---|
| Open | $312,000 | ||
| Closed | $38,900 | ||
| Closed | $312,000 |
Tax History
We collect this data history from publicly available records. To have your information removed, we recommend requesting removal directly through your county’s website.
| Year | Tax Paid | Tax Assessment Tax Assessment Total Assessment is a certain percentage of the fair market value that is determined by local assessors to be the total taxable value of land and additions on the property. | Land | Improvement |
|---|---|---|---|---|
| 2025 | $7,102 | $619,200 | $429,400 | $189,800 |
| 2024 | $6,811 | $592,800 | $408,400 | $184,400 |
| 2023 | $6,445 | $549,000 | $366,500 | $182,500 |
| 2022 | $6,039 | $470,700 | $314,200 | $156,500 |
| 2021 | $6,075 | $440,200 | $293,200 | $147,000 |
| 2020 | $6,361 | $444,800 | $261,800 | $183,000 |
| 2019 | $6,363 | $418,600 | $235,600 | $183,000 |
| 2018 | $6,309 | $394,300 | $214,700 | $179,600 |
| 2017 | $6,409 | $367,300 | $201,100 | $166,200 |
| 2016 | $6,161 | $355,500 | $201,100 | $154,400 |
| 2015 | $6,097 | $355,500 | $201,100 | $154,400 |
| 2014 | $5,825 | $311,500 | $167,600 | $143,900 |
Map
- 49 Ocean View Rd
- 67 Millett Rd
- 91 Nason Rd
- 47 Millett Rd
- 481 Humphrey St
- 5 Lexington Park
- 24 Muriel Rd
- 90 Puritan Rd
- 53 Puritan Rd
- 1 Salem St Unit 30
- 77 Shelton Rd
- 21 Salem St
- 251 Puritan Rd
- 2 Ocean Ave
- 9 Sheridan Rd
- 20 Ocean Ave
- 31 Lincoln House Point
- 3 Galloupes Terrace
- 21 Phillips Ave
- 402 Paradise Rd Unit U: 3Q
Ask me questions while you tour the home.