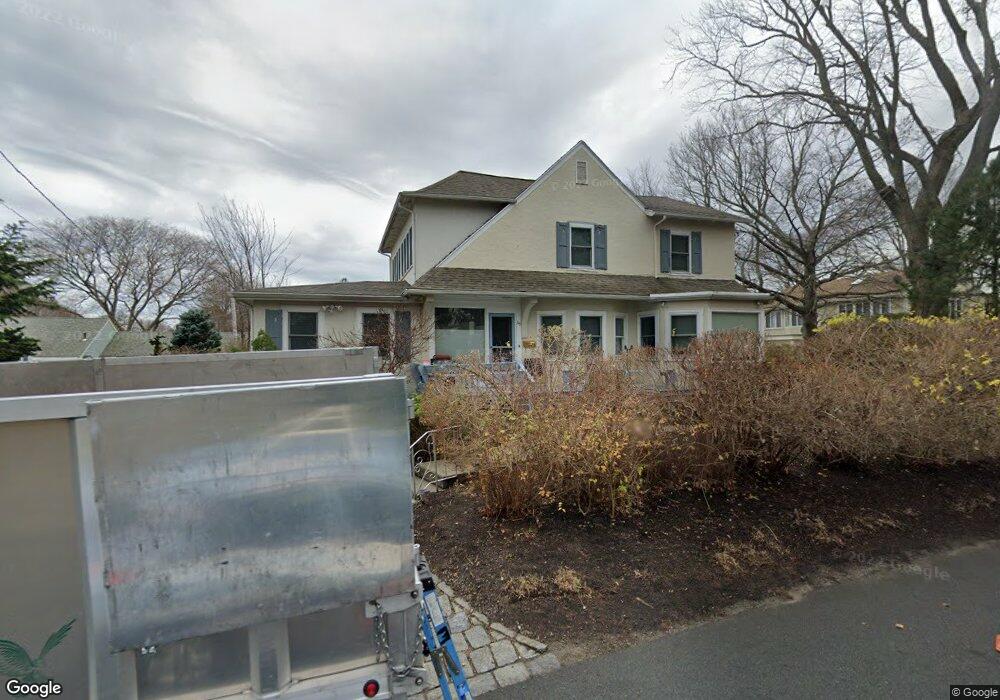
69 Seaview Ave Marblehead, MA 01945
Marblehead AreaEstimated Value: $1,470,000 - $1,684,629
About This Home
This home is located at 69 Seaview Ave, Marblehead, MA 01945 and is currently estimated at $1,587,657, approximately $326 per square foot. 69 Seaview Ave is a home located in Essex County with nearby schools including Marblehead High School, Devereux School, and Tower School.
Ownership History
We collect this data history from publicly available records. To have your information removed, we recommend requesting removal directly through your county’s website.
Purchase Details
Purchase Details
Home Values in the Area
Average Home Value in this Area
Purchase History
We collect this data history from publicly available records. To have your information removed, we recommend requesting removal directly through your county’s website.
| Date | Buyer | Sale Price | Title Company |
|---|---|---|---|
| -- | -- | ||
| $500,000 | -- |
Mortgage History
We collect this data history from publicly available records. To have your information removed, we recommend requesting removal directly through your county’s website.
| Date | Status | Borrower | Loan Amount |
|---|---|---|---|
| Open | $249,900 | ||
| Closed | $414,000 | ||
| Closed | $413,000 | ||
| Closed | $417,000 | ||
| Closed | $100,000 | ||
| Previous Owner | $200,000 | ||
| Previous Owner | $535,000 | ||
| Previous Owner | $75,000 | ||
| Previous Owner | $25,000 | ||
| Previous Owner | $108,000 |
Tax History
We collect this data history from publicly available records. To have your information removed, we recommend requesting removal directly through your county’s website.
| Year | Tax Paid | Tax Assessment Tax Assessment Total Assessment is a certain percentage of the fair market value that is determined by local assessors to be the total taxable value of land and additions on the property. | Land | Improvement |
|---|---|---|---|---|
| 2025 | $11,187 | $1,236,100 | $636,000 | $600,100 |
| 2024 | $12,514 | $1,396,600 | $808,300 | $588,300 |
| 2023 | $10,743 | $1,074,300 | $589,600 | $484,700 |
| 2022 | $10,092 | $959,300 | $490,300 | $469,000 |
| 2021 | $9,678 | $928,800 | $463,800 | $465,000 |
| 2020 | $9,329 | $897,900 | $477,000 | $420,900 |
| 2019 | $9,217 | $858,200 | $437,300 | $420,900 |
| 2018 | $9,042 | $820,500 | $424,000 | $396,500 |
| 2017 | $8,597 | $780,800 | $384,300 | $396,500 |
| 2016 | $8,079 | $727,800 | $331,300 | $396,500 |
| 2015 | $7,770 | $701,300 | $304,800 | $396,500 |
| 2014 | $7,617 | $686,800 | $278,300 | $408,500 |
Map
- 411 Atlantic Ave Unit 2
- 212 Humphrey St Unit 202
- 64 Blodgett Ave
- 187 Humphrey St
- 20 Elmwood Rd
- 21 Phillips Ave
- 30 Shetland Rd
- 8 Charlotte Rd
- 10 Charlotte Rd
- 20 Ocean Ave
- 2 Ocean Ave
- 30 Longview Dr
- 1 Salem St Unit 30
- 21 Salem St
- 25 Countryside Ln
- 91 Nason Rd
- 16 Coolidge Rd
- 3 Countryside Ln
- 5 Coolidge Rd
- 1008 Paradise Rd Unit 2E
- 132 Beach Bluff Ave
- 138 Beach Bluff Ave
- 75 Seaview Ave
- 120 Bellevue Rd
- 67 Seaview Ave
- 140 Beach Bluff Ave
- 74 Seaview Ave
- 87 Seaview Ave
- 63 Seaview Ave
- 70 Seaview Ave
- 136 Beach Bluff Ave
- 128 Beach Bluff Ave
- 82 Seaview Ave
- 144 Beach Bluff Ave
- 64 Seaview Ave
- 89 Seaview Ave
- 61 Seaview Ave
- 61 Seaview Ave Unit 1
- 25 Preston Beach Rd
- 150 Beach Bluff Ave
Ask me questions while you tour the home.