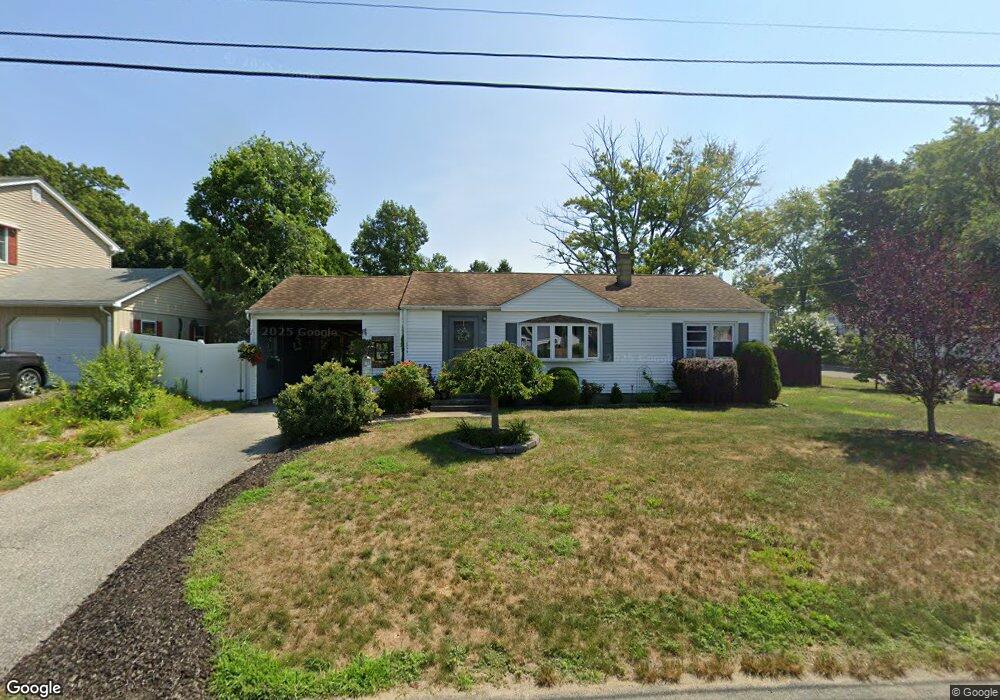
69 Westport Dr Chicopee, MA 01020
Fairview NeighborhoodEstimated Value: $288,118 - $342,000
About This Home
This home is located at 69 Westport Dr, Chicopee, MA 01020 and is currently estimated at $313,530, approximately $343 per square foot. 69 Westport Dr is a home located in Hampden County with nearby schools including Bowie Elementary School, Fairview Middle School, and Chicopee Comprehensive High School.
Ownership History
We collect this data history from publicly available records. To have your information removed, we recommend requesting removal directly through your county’s website.
Purchase Details
Home Financials for this Owner
Home Financials are based on the most recent Mortgage that was taken out on this home.Home Values in the Area
Average Home Value in this Area
Purchase History
We collect this data history from publicly available records. To have your information removed, we recommend requesting removal directly through your county’s website.
| Date | Buyer | Sale Price | Title Company |
|---|---|---|---|
| $162,500 | -- |
Mortgage History
We collect this data history from publicly available records. To have your information removed, we recommend requesting removal directly through your county’s website.
| Date | Status | Borrower | Loan Amount |
|---|---|---|---|
| Open | $159,556 |
Tax History
We collect this data history from publicly available records. To have your information removed, we recommend requesting removal directly through your county’s website.
| Year | Tax Paid | Tax Assessment Tax Assessment Total Assessment is a certain percentage of the fair market value that is determined by local assessors to be the total taxable value of land and additions on the property. | Land | Improvement |
|---|---|---|---|---|
| 2025 | $3,632 | $239,600 | $111,400 | $128,200 |
| 2024 | $3,449 | $233,700 | $109,200 | $124,500 |
| 2023 | $3,262 | $215,300 | $99,200 | $116,100 |
| 2022 | $3,128 | $184,100 | $86,300 | $97,800 |
| 2021 | $2,967 | $168,500 | $78,400 | $90,100 |
| 2020 | $2,881 | $165,000 | $80,600 | $84,400 |
| 2019 | $2,859 | $159,200 | $80,600 | $78,600 |
| 2018 | $2,796 | $152,700 | $76,800 | $75,900 |
| 2017 | $2,712 | $156,700 | $70,400 | $86,300 |
| 2016 | $2,530 | $149,600 | $70,400 | $79,200 |
| 2015 | $2,520 | $143,700 | $70,400 | $73,300 |
| 2014 | $1,260 | $143,700 | $70,400 | $73,300 |
Map
- 23 Mountainview St
- 125 Greenwood Terrace
- 106 Deslauriers St
- 224 Greenwood Terrace
- 1760 Westover Rd Unit 1
- 237 Greenwood Terrace
- 68 Honeysuckle Dr
- 55 Meadowlark Ln
- 125 Lynwood Dr Unit 6201D
- 1534 Donohue Rd
- 85 Barbara St
- 98 Greenpoint Cir
- 20 Bourbeau St
- 523 James St
- 34 Allen St
- 81 Mccarthy Ave
- 37 Woodcrest Ct
- 303 College St
- 735 Memorial Dr Unit 67
- 735 Memorial Dr Unit 94
Ask me questions while you tour the home.