693 Whiting St Hanover, MA 02339
Hanover AreaEstimated Value: $500,000 - $674,000
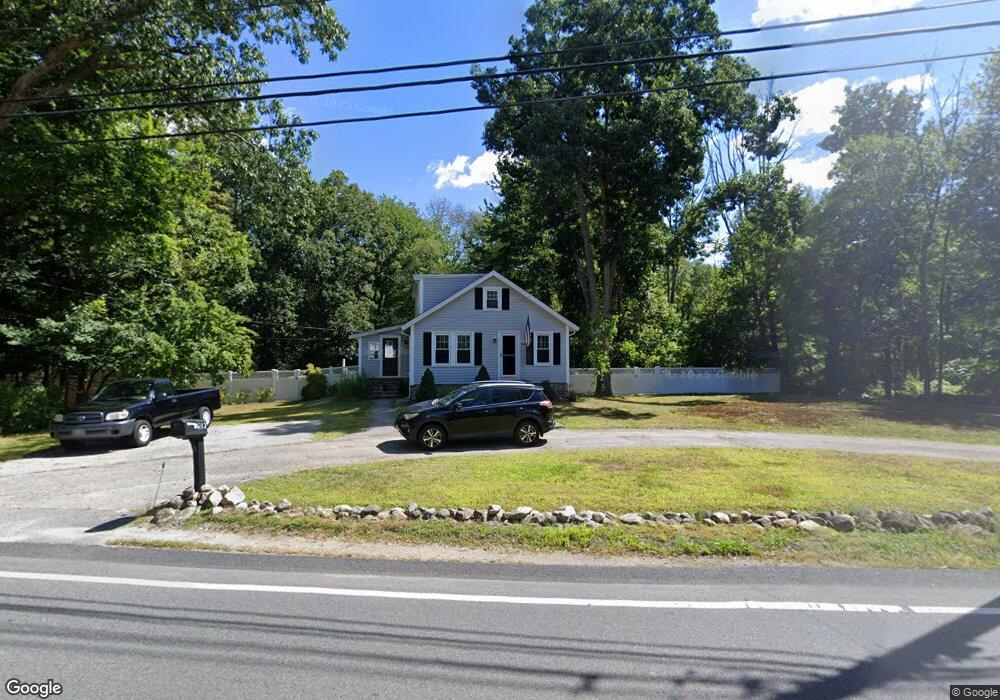
About This Home
This home is located at 693 Whiting St, Hanover, MA 02339 and is currently estimated at $569,276, approximately $494 per square foot. 693 Whiting St is a home located in Plymouth County with nearby schools including Hanover High School, South Shore Charter Public School, and Holy Family Elementary School.
Ownership History
We collect this data history from publicly available records. To have your information removed, we recommend requesting removal directly through your county’s website.
Purchase Details
Home Values in the Area
Average Home Value in this Area
Purchase History
We collect this data history from publicly available records. To have your information removed, we recommend requesting removal directly through your county’s website.
| Date | Buyer | Sale Price | Title Company |
|---|---|---|---|
| $41,900 | -- |
Mortgage History
We collect this data history from publicly available records. To have your information removed, we recommend requesting removal directly through your county’s website.
| Date | Status | Borrower | Loan Amount |
|---|---|---|---|
| Closed | $94,000 | ||
| Closed | $100,000 | ||
| Closed | $60,000 |
Tax History
We collect this data history from publicly available records. To have your information removed, we recommend requesting removal directly through your county’s website.
| Year | Tax Paid | Tax Assessment Tax Assessment Total Assessment is a certain percentage of the fair market value that is determined by local assessors to be the total taxable value of land and additions on the property. | Land | Improvement |
|---|---|---|---|---|
| 2025 | $5,335 | $432,000 | $283,600 | $148,400 |
| 2024 | $5,547 | $432,000 | $283,600 | $148,400 |
| 2023 | $5,134 | $380,600 | $258,300 | $122,300 |
| 2022 | $6,016 | $394,500 | $258,300 | $136,200 |
| 2021 | $0 | $364,200 | $235,200 | $129,000 |
| 2020 | $54,140 | $364,200 | $235,200 | $129,000 |
| 2019 | $5,680 | $346,100 | $235,200 | $110,900 |
| 2018 | $5,635 | $346,100 | $235,200 | $110,900 |
| 2017 | $5,392 | $326,400 | $218,900 | $107,500 |
| 2016 | $5,173 | $306,800 | $199,300 | $107,500 |
| 2015 | $4,742 | $293,600 | $199,300 | $94,300 |
Map
- 42 Bard Rock Ln
- 120 Deerfield Ln
- 70 Holly Berry Ln
- 25 Buffum Rd
- 16 Holly Ct
- 5 Blueberry Ct
- 198 Pond St
- 179 High St
- 177 High St
- 13 Midfield Dr Unit 13
- 76 Gardner St
- 978 Main St
- 57 Marks St
- 6 Lydon Ln Unit C1
- 375 Webster St
- 142 Marks St
- 214 Washington St Unit 28
- 36 Stone Meadow Ln
- 99 Boxberry Ln Unit 99
- 659 Liberty St
- 705 Whiting St
- 700 Whiting St
- 690 Whiting St
- 680 Whiting St
- 28 Deerfield Ln
- 2 Bard Rock Ln
- 663 Whiting St
- 723 Whiting St
- 40 Deerfield Ln
- 668 Whiting St
- 28 Bard Rock Ln
- 658 Whiting St
- 17 Town Line Dr
- 717 Whiting St
- 4 Townline Dr
- 7 Bard Rock Ln
- 37 Deerfield Ln
- 37 Deerfield Ln Unit 37
- 15 Town Line Dr Unit 15
- 6A2 Town Line Dr
Ask me questions while you tour the home.