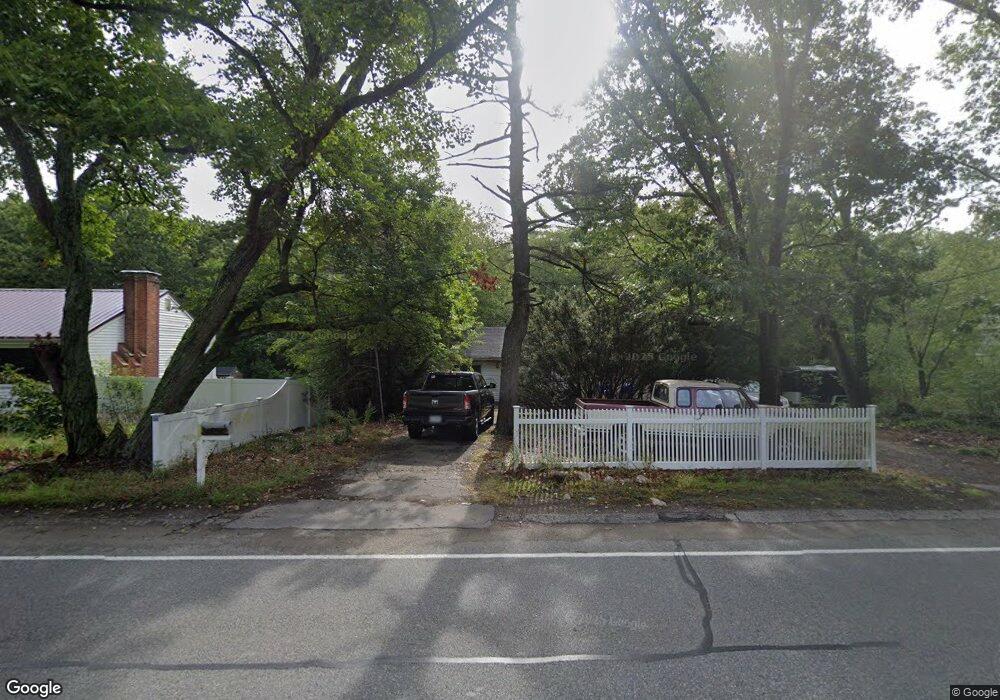
695 Hingham St Rockland, MA 02370
Estimated Value: $415,947 - $511,000
About This Home
This home is located at 695 Hingham St, Rockland, MA 02370 and is currently estimated at $451,737, approximately $573 per square foot. 695 Hingham St is a home located in Plymouth County with nearby schools including Rockland Senior High School, South Shore Charter Public School, and Holy Family Elementary School.
Ownership History
We collect this data history from publicly available records. To have your information removed, we recommend requesting removal directly through your county’s website.
Purchase Details
Home Values in the Area
Average Home Value in this Area
Purchase History
We collect this data history from publicly available records. To have your information removed, we recommend requesting removal directly through your county’s website.
| Date | Buyer | Sale Price | Title Company |
|---|---|---|---|
| $80,000 | -- |
Mortgage History
We collect this data history from publicly available records. To have your information removed, we recommend requesting removal directly through your county’s website.
| Date | Status | Borrower | Loan Amount |
|---|---|---|---|
| Open | $35,000 | ||
| Open | $109,300 |
Tax History
We collect this data history from publicly available records. To have your information removed, we recommend requesting removal directly through your county’s website.
| Year | Tax Paid | Tax Assessment Tax Assessment Total Assessment is a certain percentage of the fair market value that is determined by local assessors to be the total taxable value of land and additions on the property. | Land | Improvement |
|---|---|---|---|---|
| 2025 | $4,719 | $345,200 | $216,100 | $129,100 |
| 2024 | $4,581 | $325,800 | $203,900 | $121,900 |
| 2023 | $4,400 | $289,100 | $177,200 | $111,900 |
| 2022 | $4,214 | $251,600 | $154,100 | $97,500 |
| 2021 | $3,888 | $225,000 | $140,100 | $84,900 |
| 2020 | $3,750 | $214,300 | $133,400 | $80,900 |
| 2019 | $3,661 | $204,300 | $127,100 | $77,200 |
| 2018 | $4,692 | $188,000 | $127,100 | $60,900 |
| 2017 | $3,374 | $182,600 | $127,100 | $55,500 |
| 2016 | $3,247 | $175,600 | $122,200 | $53,400 |
| 2015 | $3,098 | $162,800 | $114,200 | $48,600 |
| 2014 | $2,929 | $159,700 | $112,000 | $47,700 |
Map
- 15 Midfield Dr Unit 15
- 13 Midfield Dr Unit 13
- 198 Pond St
- 16 Holly Ct
- 42 Bard Rock Ln
- 70 Holly Berry Ln
- 371 Gardner St
- 659 Liberty St
- 874 Union St
- 14 Sugar Maple Cir Unit 14
- 196 Myrtle St
- 491 Webster St
- 181 Greenwood St
- 230 Greenwood St
- 25 Buffum Rd
- 375 Webster St
- 48 Bigelow Ave
- 4 Leslie Ct
- 295 Gardner St
- 177 High St
- 719 Hingham St
- 693 Hingham St
- 729 Hingham St
- 687 Hingham St
- 731 Hingham St
- 677 Hingham St
- 739 Hingham St
- 18 Weymouth St
- 749 Hingham St
- 4 Weymouth St
- 653 Hingham St
- 575 Vfw Dr
- 678 Hingham St
- 767 Hingham St
- 660 Hingham St
- 651 Hingham St
- 654 Hingham St
- 586 Forest St Unit 588
- 586 Forest St Unit 1
- 771 Hingham St
Ask me questions while you tour the home.