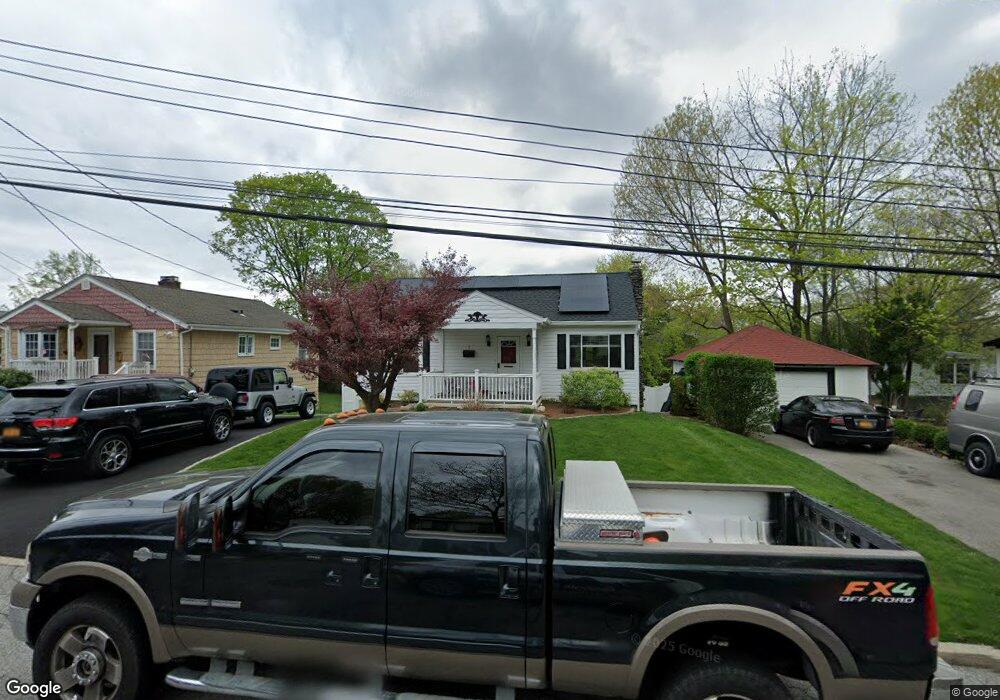
7 3rd Ave Ossining, NY 10562
Estimated Value: $471,000 - $548,000
2
Beds
1
Bath
973
Sq Ft
$525/Sq Ft
Est. Value
About This Home
This home is located at 7 3rd Ave, Ossining, NY 10562 and is currently estimated at $510,389, approximately $524 per square foot. 7 3rd Ave is a home located in Westchester County with nearby schools including Park School, Roosevelt Elementary School, and Brookside Elementary School.
Ownership History
Date
Name
Owned For
Owner Type
Purchase Details
Closed on
Dec 12, 2019
Sold by
Connolly Peter J and Connolly Rosemary
Bought by
Chavez Addison
Current Estimated Value
Home Financials for this Owner
Home Financials are based on the most recent Mortgage that was taken out on this home.
Original Mortgage
$299,250
Outstanding Balance
$260,392
Interest Rate
3.6%
Mortgage Type
New Conventional
Estimated Equity
$249,997
Purchase Details
Closed on
Dec 20, 2005
Sold by
Connolly Kevin P and Connolly Peter J
Bought by
Connolly Peter J and Connolly Rosemary
Create a Home Valuation Report for This Property
The Home Valuation Report is an in-depth analysis detailing your home's value as well as a comparison with similar homes in the area
Home Values in the Area
Average Home Value in this Area
Purchase History
| Date | Buyer | Sale Price | Title Company |
|---|---|---|---|
| Chavez Addison | $315,000 | All New York Title Agency | |
| Connolly Peter J | $180,000 | None Available | |
| Connolly Peter J | -- | None Available |
Source: Public Records
Mortgage History
| Date | Status | Borrower | Loan Amount |
|---|---|---|---|
| Open | Chavez Addison | $299,250 |
Source: Public Records
Tax History
| Year | Tax Paid | Tax Assessment Tax Assessment Total Assessment is a certain percentage of the fair market value that is determined by local assessors to be the total taxable value of land and additions on the property. | Land | Improvement |
|---|---|---|---|---|
| 2024 | $12,086 | $375,000 | $150,600 | $224,400 |
| 2023 | $11,758 | $353,300 | $150,600 | $202,700 |
| 2022 | $11,656 | $324,300 | $150,600 | $173,700 |
| 2021 | $10,248 | $289,600 | $150,600 | $139,000 |
| 2020 | $11,378 | $289,600 | $150,600 | $139,000 |
| 2019 | $11,434 | $270,300 | $150,600 | $119,700 |
| 2018 | $11,183 | $270,300 | $150,600 | $119,700 |
| 2017 | $1,409 | $265,100 | $150,600 | $114,500 |
| 2016 | $125,370 | $259,900 | $150,600 | $109,300 |
| 2015 | -- | $13,400 | $3,700 | $9,700 |
| 2014 | -- | $13,400 | $3,700 | $9,700 |
| 2013 | -- | $13,400 | $3,700 | $9,700 |
Source: Public Records
Map
Nearby Homes
- 10 Pine Brook Rd
- 48 Pershing Ave
- 19 Forest Ave
- 16 Robin St
- 42 Campwoods Grounds
- 15 Marshall Place
- 4 Spaulding Place
- 7 Hawkes Ave
- 41 Croton Dam Rd
- 1C Calam Ave
- 15 Prospect Ave
- 132 Croton Ave
- 76 Hawkes Ave
- 38 Terrace Ave
- 36 Watson Ave
- 200 Route 9a
- 42 Brooke View Dr
- 23 Apple Ln
- 59 Watson Ave
- 35 Havell St
Your Personal Tour Guide
Ask me questions while you tour the home.