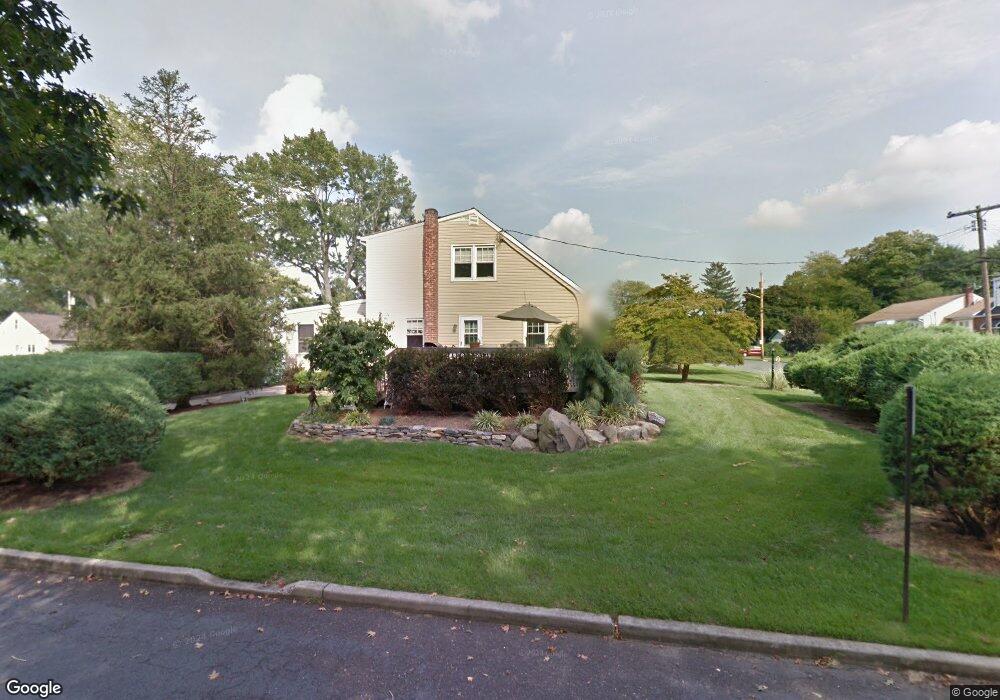
7 5th St Matawan, NJ 07747
Estimated Value: $679,000 - $731,000
3
Beds
1
Bath
2,077
Sq Ft
$335/Sq Ft
Est. Value
About This Home
This home is located at 7 5th St, Matawan, NJ 07747 and is currently estimated at $696,267, approximately $335 per square foot. 7 5th St is a home located in Monmouth County with nearby schools including Matawan Reg High School, St Benedict School, and St. Joseph Elementary School.
Ownership History
Date
Name
Owned For
Owner Type
Purchase Details
Closed on
Sep 6, 2022
Sold by
Vena and Lisa
Bought by
Brown Tracie R Bekka
Current Estimated Value
Home Financials for this Owner
Home Financials are based on the most recent Mortgage that was taken out on this home.
Original Mortgage
$275,000
Outstanding Balance
$262,173
Interest Rate
4.99%
Mortgage Type
New Conventional
Estimated Equity
$434,094
Purchase Details
Closed on
Mar 31, 2004
Sold by
Kwan Judy
Bought by
Vena Charles and Vena Lisa
Home Financials for this Owner
Home Financials are based on the most recent Mortgage that was taken out on this home.
Original Mortgage
$165,000
Interest Rate
5.4%
Create a Home Valuation Report for This Property
The Home Valuation Report is an in-depth analysis detailing your home's value as well as a comparison with similar homes in the area
Home Values in the Area
Average Home Value in this Area
Purchase History
| Date | Buyer | Sale Price | Title Company |
|---|---|---|---|
| Brown Tracie R Bekka | $550,000 | -- | |
| Brown Tracie R Bekka | $550,000 | None Listed On Document | |
| Vena Charles | $270,000 | -- |
Source: Public Records
Mortgage History
| Date | Status | Borrower | Loan Amount |
|---|---|---|---|
| Open | Brown Tracie R Bekka | $275,000 | |
| Closed | Brown Tracie R Bekka | $275,000 | |
| Previous Owner | Vena Charles | $165,000 |
Source: Public Records
Tax History
| Year | Tax Paid | Tax Assessment Tax Assessment Total Assessment is a certain percentage of the fair market value that is determined by local assessors to be the total taxable value of land and additions on the property. | Land | Improvement |
|---|---|---|---|---|
| 2025 | $11,390 | $622,700 | $362,800 | $259,900 |
| 2024 | $11,784 | $563,600 | $308,500 | $255,100 |
| 2023 | $11,784 | $550,900 | $301,700 | $249,200 |
| 2022 | $10,298 | $430,900 | $193,700 | $237,200 |
| 2021 | $10,298 | $381,000 | $170,000 | $211,000 |
| 2020 | $10,028 | $369,500 | $163,300 | $206,200 |
| 2019 | $10,290 | $368,300 | $163,300 | $205,000 |
| 2018 | $10,276 | $368,700 | $173,200 | $195,500 |
| 2017 | $10,022 | $364,700 | $182,200 | $182,500 |
| 2016 | $9,218 | $350,100 | $172,200 | $177,900 |
| 2015 | $9,614 | $350,500 | $177,200 | $173,300 |
| 2014 | $9,399 | $349,400 | $177,200 | $172,200 |
Source: Public Records
Map
Nearby Homes
Your Personal Tour Guide
Ask me questions while you tour the home.