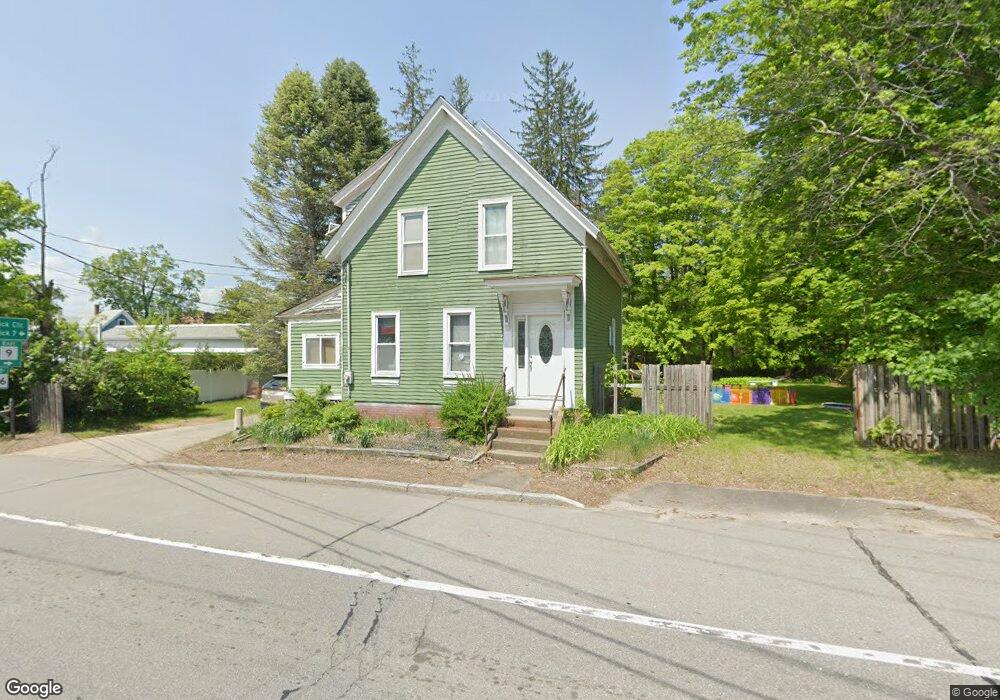
7 Allen St Berwick, ME 03901
Estimated Value: $375,575 - $504,000
3
Beds
2
Baths
1,449
Sq Ft
$295/Sq Ft
Est. Value
About This Home
This home is located at 7 Allen St, Berwick, ME 03901 and is currently estimated at $427,394, approximately $294 per square foot. 7 Allen St is a home located in York County with nearby schools including Noble High School and Tri-City Christian Academy.
Ownership History
Date
Name
Owned For
Owner Type
Purchase Details
Closed on
Aug 22, 2006
Sold by
Herrick Michelle E and Herrick James A
Bought by
Knapp Monique D and Knapp Thomas R
Current Estimated Value
Home Financials for this Owner
Home Financials are based on the most recent Mortgage that was taken out on this home.
Original Mortgage
$164,000
Outstanding Balance
$97,047
Interest Rate
6.88%
Mortgage Type
Purchase Money Mortgage
Estimated Equity
$330,347
Create a Home Valuation Report for This Property
The Home Valuation Report is an in-depth analysis detailing your home's value as well as a comparison with similar homes in the area
Home Values in the Area
Average Home Value in this Area
Purchase History
| Date | Buyer | Sale Price | Title Company |
|---|---|---|---|
| Knapp Monique D | -- | -- | |
| Knapp Monique D | -- | -- | |
| Knapp Monique D | -- | -- |
Source: Public Records
Mortgage History
| Date | Status | Borrower | Loan Amount |
|---|---|---|---|
| Open | Knapp Monique D | $164,000 | |
| Closed | Knapp Monique D | $164,000 |
Source: Public Records
Tax History
| Year | Tax Paid | Tax Assessment Tax Assessment Total Assessment is a certain percentage of the fair market value that is determined by local assessors to be the total taxable value of land and additions on the property. | Land | Improvement |
|---|---|---|---|---|
| 2025 | $4,466 | $342,500 | $115,600 | $226,900 |
| 2024 | $4,271 | $342,500 | $115,600 | $226,900 |
| 2023 | $4,010 | $218,900 | $82,600 | $136,300 |
| 2022 | $3,988 | $218,900 | $82,600 | $136,300 |
| 2021 | $4,006 | $218,900 | $82,600 | $136,300 |
| 2020 | $4,238 | $218,900 | $82,600 | $136,300 |
| 2019 | $937 | $218,900 | $82,600 | $136,300 |
| 2018 | $2,417 | $203,700 | $74,800 | $128,900 |
| 2017 | $914 | $203,700 | $74,800 | $128,900 |
| 2016 | $3,320 | $203,700 | $74,800 | $128,900 |
| 2014 | $3,239 | $203,700 | $74,800 | $128,900 |
| 2013 | $3,407 | $212,300 | $74,800 | $137,500 |
Source: Public Records
Map
Nearby Homes
Your Personal Tour Guide
Ask me questions while you tour the home.