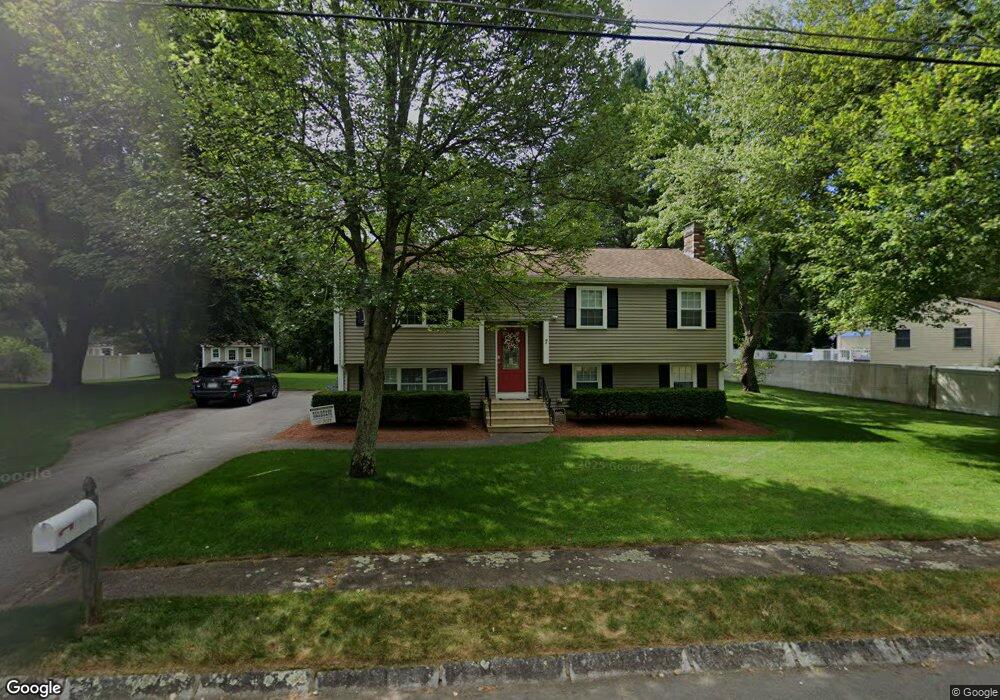
7 Barton Rd Foxboro, MA 02035
Estimated Value: $612,129 - $715,000
4
Beds
1
Bath
1,800
Sq Ft
$371/Sq Ft
Est. Value
About This Home
This home is located at 7 Barton Rd, Foxboro, MA 02035 and is currently estimated at $667,032, approximately $370 per square foot. 7 Barton Rd is a home located in Norfolk County with nearby schools including Foxborough High School, Discovery Daycare Center, and Hands-On-Montessori School.
Ownership History
Date
Name
Owned For
Owner Type
Purchase Details
Closed on
May 14, 2010
Sold by
Flynn Jean M and Flynn Martina J
Bought by
Panasuik William R and Panasuik Melissa A
Current Estimated Value
Home Financials for this Owner
Home Financials are based on the most recent Mortgage that was taken out on this home.
Original Mortgage
$248,000
Outstanding Balance
$166,712
Interest Rate
5.11%
Mortgage Type
Purchase Money Mortgage
Estimated Equity
$500,320
Create a Home Valuation Report for This Property
The Home Valuation Report is an in-depth analysis detailing your home's value as well as a comparison with similar homes in the area
Home Values in the Area
Average Home Value in this Area
Purchase History
We collect this data history from publicly available records. To have your information removed, we recommend requesting removal directly through your county’s website.
| Date | Buyer | Sale Price | Title Company |
|---|---|---|---|
| Panasuik William R | $313,200 | -- |
Source: Public Records
Mortgage History
We collect this data history from publicly available records. To have your information removed, we recommend requesting removal directly through your county’s website.
| Date | Status | Borrower | Loan Amount |
|---|---|---|---|
| Open | Panasuik William R | $248,000 |
Source: Public Records
Tax History
| Year | Tax Paid | Tax Assessment Tax Assessment Total Assessment is a certain percentage of the fair market value that is determined by local assessors to be the total taxable value of land and additions on the property. | Land | Improvement |
|---|---|---|---|---|
| 2025 | $6,420 | $485,600 | $243,000 | $242,600 |
| 2024 | $6,336 | $469,000 | $247,400 | $221,600 |
| 2023 | $6,167 | $434,000 | $235,600 | $198,400 |
| 2022 | $5,587 | $384,800 | $197,500 | $187,300 |
| 2021 | $5,214 | $353,700 | $182,900 | $170,800 |
| 2020 | $4,882 | $335,100 | $182,900 | $152,200 |
| 2019 | $4,783 | $325,400 | $174,200 | $151,200 |
| 2018 | $4,664 | $320,100 | $174,200 | $145,900 |
| 2017 | $4,402 | $292,700 | $162,800 | $129,900 |
| 2016 | $4,452 | $300,400 | $164,100 | $136,300 |
| 2015 | $4,217 | $277,600 | $138,800 | $138,800 |
| 2014 | $4,025 | $268,500 | $129,700 | $138,800 |
Source: Public Records
Map
Nearby Homes
Your Personal Tour Guide
Ask me questions while you tour the home.