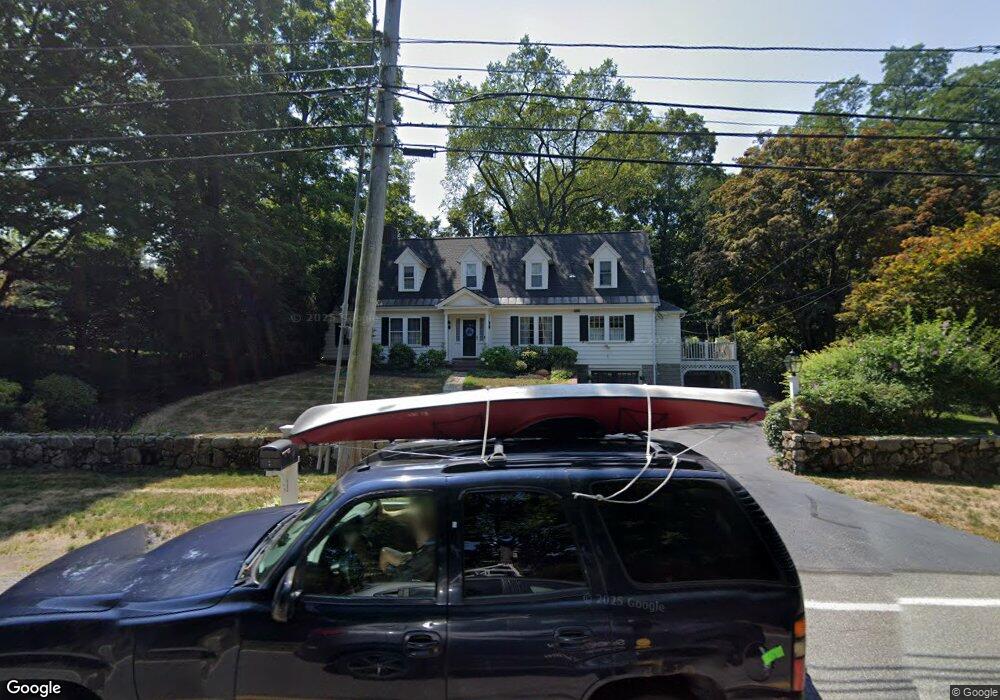
7 Cherry St Wenham, MA 01984
Estimated Value: $874,000 - $1,184,000
3
Beds
3
Baths
2,217
Sq Ft
$470/Sq Ft
Est. Value
About This Home
This home is located at 7 Cherry St, Wenham, MA 01984 and is currently estimated at $1,041,422, approximately $469 per square foot. 7 Cherry St is a home located in Essex County with nearby schools including Winthrop School, Bessie Buker Elementary School, and Cutler Elementary School.
Ownership History
Date
Name
Owned For
Owner Type
Purchase Details
Closed on
Feb 2, 2023
Sold by
Brown Alan F
Bought by
Alan Brown 2020 T
Current Estimated Value
Purchase Details
Closed on
Jun 23, 2006
Sold by
Primacy Closing Corp
Bought by
Brown Alan F and Damour Karen M
Purchase Details
Closed on
Jul 25, 1994
Sold by
Reynolds Allan E and Reynolds Aileen H
Bought by
Svete Robert J and Svets Ticia Cawley
Create a Home Valuation Report for This Property
The Home Valuation Report is an in-depth analysis detailing your home's value as well as a comparison with similar homes in the area
Home Values in the Area
Average Home Value in this Area
Purchase History
| Date | Buyer | Sale Price | Title Company |
|---|---|---|---|
| Alan Brown 2020 T | -- | None Available | |
| Brown Alan F | $620,000 | -- | |
| Primacy Closing Corp | $620,000 | -- | |
| Svete Robert J | $300,000 | -- |
Source: Public Records
Mortgage History
| Date | Status | Borrower | Loan Amount |
|---|---|---|---|
| Previous Owner | Svete Robert J | $311,200 | |
| Previous Owner | Svete Robert J | $316,200 |
Source: Public Records
Tax History
| Year | Tax Paid | Tax Assessment Tax Assessment Total Assessment is a certain percentage of the fair market value that is determined by local assessors to be the total taxable value of land and additions on the property. | Land | Improvement |
|---|---|---|---|---|
| 2025 | $14,622 | $940,900 | $505,200 | $435,700 |
| 2024 | $14,330 | $915,100 | $505,200 | $409,900 |
| 2023 | $13,521 | $779,300 | $501,300 | $278,000 |
| 2022 | $11,946 | $610,100 | $343,800 | $266,300 |
| 2021 | $11,505 | $584,600 | $318,300 | $266,300 |
| 2020 | $10,622 | $560,800 | $314,300 | $246,500 |
| 2019 | $10,106 | $560,800 | $314,300 | $246,500 |
| 2018 | $8,209 | $436,900 | $304,200 | $132,700 |
| 2017 | $8,008 | $436,900 | $304,200 | $132,700 |
| 2016 | $7,419 | $436,900 | $304,200 | $132,700 |
| 2015 | $6,651 | $409,300 | $276,600 | $132,700 |
Source: Public Records
Map
Nearby Homes
Your Personal Tour Guide
Ask me questions while you tour the home.