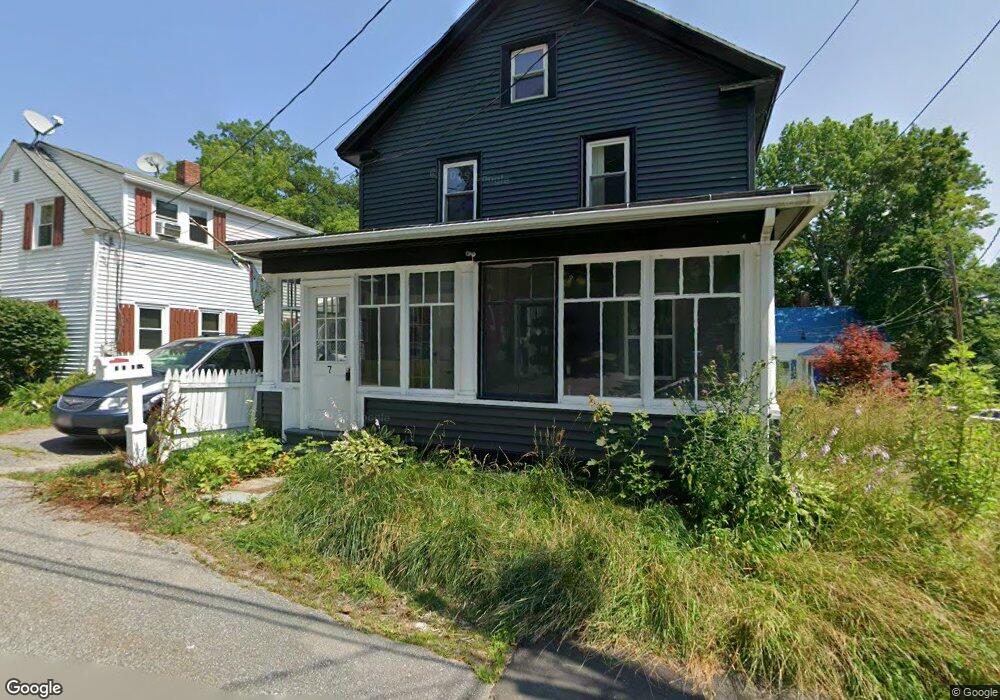
7 Flagg St Augusta, ME 04330
Estimated Value: $49,000 - $215,000
4
Beds
2
Baths
1,353
Sq Ft
$104/Sq Ft
Est. Value
About This Home
This home is located at 7 Flagg St, Augusta, ME 04330 and is currently estimated at $140,837, approximately $104 per square foot. 7 Flagg St is a home located in Kennebec County with nearby schools including Cony Middle School, Cony School, and Maine Virtual Academy.
Ownership History
Date
Name
Owned For
Owner Type
Purchase Details
Closed on
Aug 29, 2025
Sold by
Saucier Wanda
Bought by
Haydym David and Haydym Leonid
Current Estimated Value
Purchase Details
Closed on
Oct 22, 2015
Sold by
Pedersen John and Pedersen Bonnie
Bought by
Saucier Wanda
Home Financials for this Owner
Home Financials are based on the most recent Mortgage that was taken out on this home.
Original Mortgage
$51,640
Interest Rate
3.9%
Mortgage Type
New Conventional
Create a Home Valuation Report for This Property
The Home Valuation Report is an in-depth analysis detailing your home's value as well as a comparison with similar homes in the area
Home Values in the Area
Average Home Value in this Area
Purchase History
| Date | Buyer | Sale Price | Title Company |
|---|---|---|---|
| Haydym David | $50,000 | -- | |
| Haydym David | $50,000 | -- | |
| Haydym David | $50,000 | -- | |
| Saucier Wanda | -- | -- | |
| Saucier Wanda | -- | -- |
Source: Public Records
Mortgage History
| Date | Status | Borrower | Loan Amount |
|---|---|---|---|
| Previous Owner | Saucier Wanda | $51,640 |
Source: Public Records
Tax History
| Year | Tax Paid | Tax Assessment Tax Assessment Total Assessment is a certain percentage of the fair market value that is determined by local assessors to be the total taxable value of land and additions on the property. | Land | Improvement |
|---|---|---|---|---|
| 2025 | $2,028 | $83,100 | $18,000 | $65,100 |
| 2024 | $1,978 | $83,100 | $18,000 | $65,100 |
| 2023 | $1,750 | $76,200 | $18,000 | $58,200 |
| 2022 | $1,670 | $76,200 | $18,000 | $58,200 |
| 2021 | $1,558 | $74,400 | $18,000 | $56,400 |
| 2020 | $1,558 | $74,400 | $18,000 | $56,400 |
| 2019 | $1,560 | $74,400 | $18,000 | $56,400 |
| 2018 | $1,560 | $74,400 | $18,000 | $56,400 |
| 2017 | $1,516 | $74,400 | $18,000 | $56,400 |
| 2016 | $1,472 | $74,400 | $18,000 | $56,400 |
| 2015 | $1,443 | $74,400 | $18,000 | $56,400 |
| 2014 | $1,389 | $74,400 | $18,000 | $56,400 |
Source: Public Records
Map
Nearby Homes
Your Personal Tour Guide
Ask me questions while you tour the home.