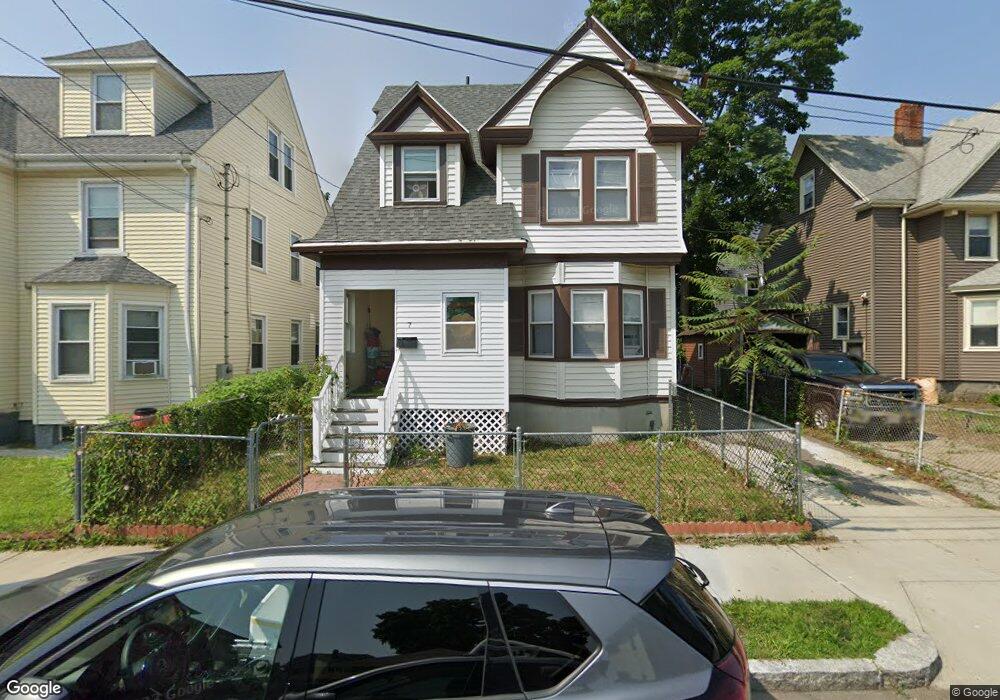
7 Flynt St Quincy, MA 02171
North Quincy NeighborhoodEstimated Value: $694,000 - $728,874
About This Home
This home is located at 7 Flynt St, Quincy, MA 02171 and is currently estimated at $705,469, approximately $508 per square foot. 7 Flynt St is a home located in Norfolk County with nearby schools including Francis W. Parker Elementary School, Atlantic Middle School, and North Quincy High School.
Ownership History
We collect this data history from publicly available records. To have your information removed, we recommend requesting removal directly through your county’s website.
Purchase Details
Purchase Details
Purchase Details
Home Values in the Area
Average Home Value in this Area
Purchase History
We collect this data history from publicly available records. To have your information removed, we recommend requesting removal directly through your county’s website.
| Date | Buyer | Sale Price | Title Company |
|---|---|---|---|
| -- | None Available | ||
| -- | None Available | ||
| -- | -- | ||
| -- | -- | ||
| $295,000 | -- | ||
| $295,000 | -- |
Mortgage History
We collect this data history from publicly available records. To have your information removed, we recommend requesting removal directly through your county’s website.
| Date | Status | Borrower | Loan Amount |
|---|---|---|---|
| Previous Owner | $30,500 | ||
| Previous Owner | $27,756 | ||
| Previous Owner | $25,000 |
Tax History
We collect this data history from publicly available records. To have your information removed, we recommend requesting removal directly through your county’s website.
| Year | Tax Paid | Tax Assessment Tax Assessment Total Assessment is a certain percentage of the fair market value that is determined by local assessors to be the total taxable value of land and additions on the property. | Land | Improvement |
|---|---|---|---|---|
| 2025 | $7,094 | $615,300 | $322,900 | $292,400 |
| 2024 | $6,808 | $604,100 | $322,900 | $281,200 |
| 2023 | $6,231 | $559,800 | $293,500 | $266,300 |
| 2022 | $5,986 | $499,700 | $234,800 | $264,900 |
| 2021 | $5,669 | $467,000 | $234,800 | $232,200 |
| 2020 | $5,555 | $446,900 | $230,200 | $216,700 |
| 2019 | $5,450 | $434,300 | $221,300 | $213,000 |
| 2018 | $5,285 | $396,200 | $210,800 | $185,400 |
| 2017 | $5,151 | $363,500 | $191,600 | $171,900 |
| 2016 | $4,801 | $334,300 | $174,200 | $160,100 |
| 2015 | $4,452 | $304,900 | $158,400 | $146,500 |
| 2014 | $4,302 | $289,500 | $158,400 | $131,100 |
Map
- 260 Newbury Ave
- 16 W Squantum St
- 17 Holmes St Unit PH
- 19 Holmes St Unit 1
- 46 Warwick St
- 45 Holbrook Rd
- 174 Beach St
- 67 Colby Rd
- 153 Vassall St
- 115 W Squantum St Unit 203
- 135 Safford St
- 75 Walker St
- 113 Elm Ave
- 267-269 Farrington St
- 99 Phillips St
- 60 Montclair Ave
- 150 Hancock St Unit 101
- 15 Becket St
- 60 Harriet Ave
- 13 Wentworth Rd Unit 404
- 101 Billings Rd
- 97 Billings Rd
- 9 Flynt St Unit 1
- 9 Flynt St
- 9 - 11 Flynt St
- 109 Billings Rd
- 109 Billings Rd Unit 2
- 109 Billings Rd Unit 1
- 91 Billings Rd Unit 2
- 91 Billings Rd Unit 3
- 91 Billings Rd
- 91 Billings Rd Unit B
- 91 Billings Rd Unit 1B
- 91 Billings Rd Unit 1L
- 12 Lunt St
- 13 Flynt St
- 102 Billings Rd
- 108 Billings Rd Unit 108
- 106 Billings Rd
- 106 Billings Rd Unit Rear Right
Ask me questions while you tour the home.