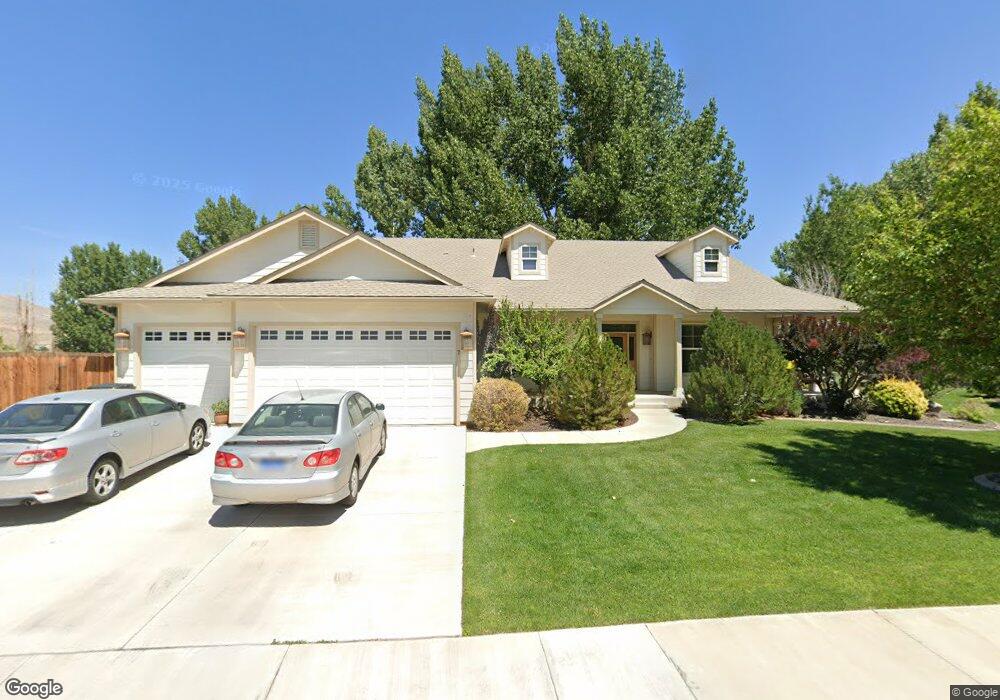
7 Jacob Rd Yerington, NV 89447
Estimated Value: $477,862 - $549,000
3
Beds
2
Baths
2,223
Sq Ft
$233/Sq Ft
Est. Value
About This Home
This home is located at 7 Jacob Rd, Yerington, NV 89447 and is currently estimated at $518,716, approximately $233 per square foot. 7 Jacob Rd is a home located in Lyon County with nearby schools including Yerington Elementary School, Yerington Intermediate School, and Yerington High School.
Ownership History
Date
Name
Owned For
Owner Type
Purchase Details
Closed on
May 2, 2006
Sold by
Jeff Kirby Homes Inc
Bought by
Jones Jerald B and Jones Keyna A
Current Estimated Value
Home Financials for this Owner
Home Financials are based on the most recent Mortgage that was taken out on this home.
Original Mortgage
$220,000
Outstanding Balance
$12,606
Interest Rate
6.29%
Mortgage Type
Purchase Money Mortgage
Estimated Equity
$506,110
Purchase Details
Closed on
Jan 19, 2005
Sold by
Carter Joe M and Carter Camille
Bought by
Jeff Kirby Homes Inc
Create a Home Valuation Report for This Property
The Home Valuation Report is an in-depth analysis detailing your home's value as well as a comparison with similar homes in the area
Home Values in the Area
Average Home Value in this Area
Purchase History
| Date | Buyer | Sale Price | Title Company |
|---|---|---|---|
| Jones Jerald B | $422,282 | Stewart Title Company | |
| Jeff Kirby Homes Inc | $52,000 | Stewart Title Company |
Source: Public Records
Mortgage History
| Date | Status | Borrower | Loan Amount |
|---|---|---|---|
| Open | Jones Jerald B | $220,000 |
Source: Public Records
Tax History
| Year | Tax Paid | Tax Assessment Tax Assessment Total Assessment is a certain percentage of the fair market value that is determined by local assessors to be the total taxable value of land and additions on the property. | Land | Improvement |
|---|---|---|---|---|
| 2025 | $7,359 | $131,329 | $33,250 | $98,079 |
| 2024 | $3,306 | $131,850 | $33,250 | $98,599 |
| 2023 | $3,306 | $123,805 | $31,500 | $92,305 |
| 2022 | $3,103 | $101,071 | $15,750 | $85,321 |
| 2021 | $3,008 | $92,477 | $9,275 | $83,202 |
| 2020 | $2,920 | $89,062 | $9,280 | $79,782 |
| 2019 | $2,835 | $86,084 | $9,280 | $76,804 |
| 2018 | $2,753 | $84,206 | $9,280 | $74,926 |
| 2017 | $2,673 | $84,179 | $9,280 | $74,899 |
| 2016 | $2,606 | $85,489 | $9,280 | $76,209 |
| 2015 | $2,600 | $71,851 | $9,280 | $62,571 |
| 2014 | $2,525 | $68,198 | $9,280 | $58,918 |
Source: Public Records
Map
Nearby Homes
Your Personal Tour Guide
Ask me questions while you tour the home.