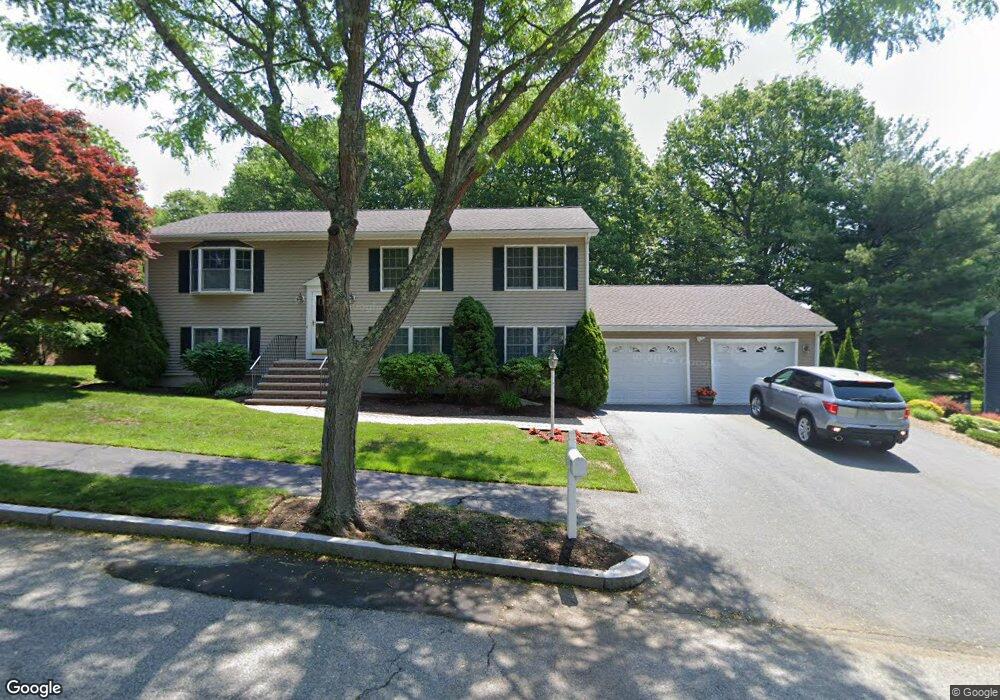
7 Kyleigh Ln Peabody, MA 01960
South Peabody NeighborhoodEstimated Value: $818,000 - $987,000
About This Home
This home is located at 7 Kyleigh Ln, Peabody, MA 01960 and is currently estimated at $883,769, approximately $454 per square foot. 7 Kyleigh Ln is a home located in Essex County with nearby schools including Peabody Veterans Memorial High School and North Shore Christian School.
Ownership History
We collect this data history from publicly available records. To have your information removed, we recommend requesting removal directly through your county’s website.
Purchase Details
Home Financials for this Owner
Home Financials are based on the most recent Mortgage that was taken out on this home.Home Values in the Area
Average Home Value in this Area
Purchase History
We collect this data history from publicly available records. To have your information removed, we recommend requesting removal directly through your county’s website.
| Date | Buyer | Sale Price | Title Company |
|---|---|---|---|
| $207,500 | -- |
Mortgage History
We collect this data history from publicly available records. To have your information removed, we recommend requesting removal directly through your county’s website.
| Date | Status | Borrower | Loan Amount |
|---|---|---|---|
| Open | $100,000 | ||
| Closed | $50,000 | ||
| Closed | $128,000 | ||
| Closed | $132,500 |
Tax History
We collect this data history from publicly available records. To have your information removed, we recommend requesting removal directly through your county’s website.
| Year | Tax Paid | Tax Assessment Tax Assessment Total Assessment is a certain percentage of the fair market value that is determined by local assessors to be the total taxable value of land and additions on the property. | Land | Improvement |
|---|---|---|---|---|
| 2025 | $7,089 | $765,500 | $297,500 | $468,000 |
| 2024 | $6,518 | $714,700 | $297,500 | $417,200 |
| 2023 | $5,823 | $611,700 | $248,000 | $363,700 |
| 2022 | $5,513 | $545,800 | $215,600 | $330,200 |
| 2021 | $5,528 | $527,000 | $196,000 | $331,000 |
| 2020 | $5,567 | $518,300 | $196,000 | $322,300 |
| 2019 | $5,353 | $486,200 | $196,000 | $290,200 |
| 2018 | $4,805 | $419,300 | $175,000 | $244,300 |
| 2017 | $4,700 | $399,700 | $175,000 | $224,700 |
| 2016 | $4,294 | $360,200 | $175,000 | $185,200 |
| 2015 | $4,339 | $352,800 | $175,000 | $177,800 |
Map
- 19 Bartholomew Terrace
- 2 Columbia Blvd
- 38 Sandra Rd
- 9 Longview Way
- 40 County St
- 2 Johnson Ave
- 32 Coolidge Ave
- 131 Range Heights Rd
- 12 Cannon Rock Rd
- 196 Bartholomew St
- 23 Batchelder Ave
- 3 Christina Dr Unit A
- 300 Lynn St
- 40 Glenwood Rd
- 52 Glenwood Rd
- 74 Harris Rd
- 34 Dona Rd
- 19 Broadway Cir
- 53 Longhill Rd
- 257 Lynnfield St
Ask me questions while you tour the home.