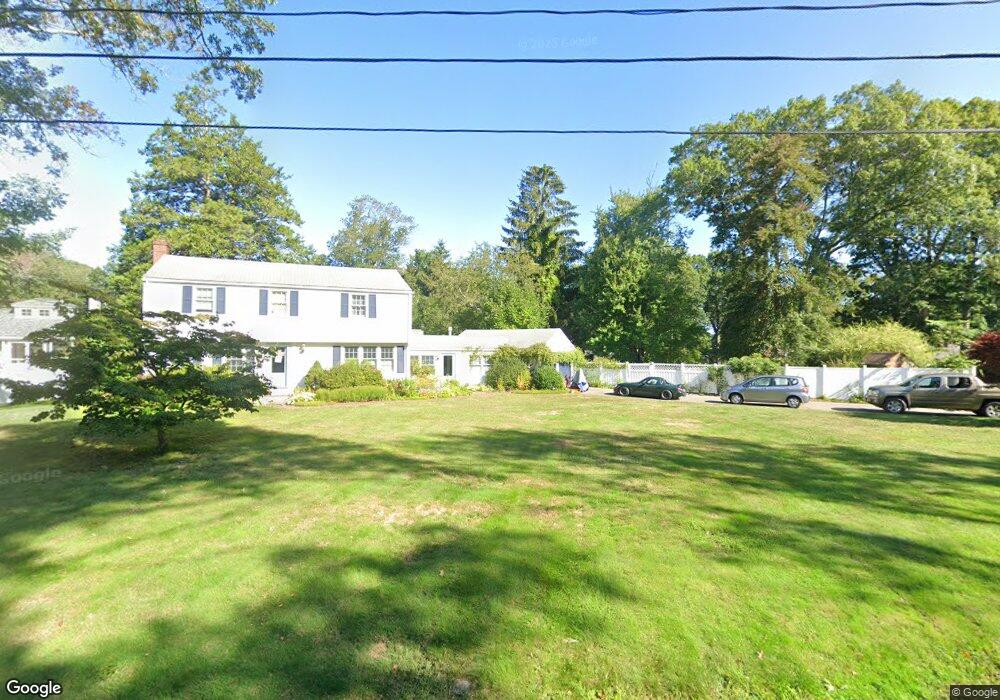
7 Lee Ave Scituate, MA 02066
Estimated Value: $881,978 - $1,065,000
About This Home
This home is located at 7 Lee Ave, Scituate, MA 02066 and is currently estimated at $960,495, approximately $492 per square foot. 7 Lee Ave is a home located in Plymouth County with nearby schools including Wampatuck Elementary School, Lester J. Gates Middle School, and Scituate High School.
Ownership History
We collect this data history from publicly available records. To have your information removed, we recommend requesting removal directly through your county’s website.
Purchase Details
Purchase Details
Home Financials for this Owner
Home Financials are based on the most recent Mortgage that was taken out on this home.Home Values in the Area
Average Home Value in this Area
Purchase History
We collect this data history from publicly available records. To have your information removed, we recommend requesting removal directly through your county’s website.
| Date | Buyer | Sale Price | Title Company |
|---|---|---|---|
| -- | None Available | ||
| $227,000 | -- | ||
| $227,000 | -- |
Mortgage History
We collect this data history from publicly available records. To have your information removed, we recommend requesting removal directly through your county’s website.
| Date | Status | Borrower | Loan Amount |
|---|---|---|---|
| Previous Owner | $127,200 | ||
| Previous Owner | $145,000 |
Tax History
We collect this data history from publicly available records. To have your information removed, we recommend requesting removal directly through your county’s website.
| Year | Tax Paid | Tax Assessment Tax Assessment Total Assessment is a certain percentage of the fair market value that is determined by local assessors to be the total taxable value of land and additions on the property. | Land | Improvement |
|---|---|---|---|---|
| 2025 | $7,331 | $733,800 | $371,700 | $362,100 |
| 2024 | $7,179 | $693,000 | $337,900 | $355,100 |
| 2023 | $7,183 | $653,100 | $324,200 | $328,900 |
| 2022 | $7,183 | $569,200 | $292,200 | $277,000 |
| 2021 | $7,020 | $526,600 | $278,300 | $248,300 |
| 2020 | $6,813 | $504,700 | $267,600 | $237,100 |
| 2019 | $6,690 | $486,900 | $262,300 | $224,600 |
| 2018 | $6,529 | $468,000 | $262,900 | $205,100 |
| 2017 | $6,342 | $450,100 | $252,000 | $198,100 |
| 2016 | $6,055 | $428,200 | $230,100 | $198,100 |
| 2015 | $5,465 | $417,200 | $219,100 | $198,100 |
Map
- 6 Jackson Rd
- 43 Jackson Rd
- 49 James Way
- 49 Jackson Rd
- 32 Branch St
- 74 Branch St Unit 15
- 320 First Parish Rd
- 35 Beach Plum Ln
- 23 Grace Way
- 6 Grace Way Unit 6
- 1 Grace Way Unit 1
- 20 Grace Way Unit 20
- 156 First Parish Rd Unit 6
- 66 Station St
- 2 Rachels Way Unit 2
- 24 Merritt Ln
- 5 Brand Blvd Unit 5
- 171 Lawson Rd
- 58 Brook St
- 15 Hazel Ave
Ask me questions while you tour the home.