7 Montello St Worcester, MA 01603
Hadwen Park NeighborhoodEstimated Value: $441,000 - $485,000
About This Home
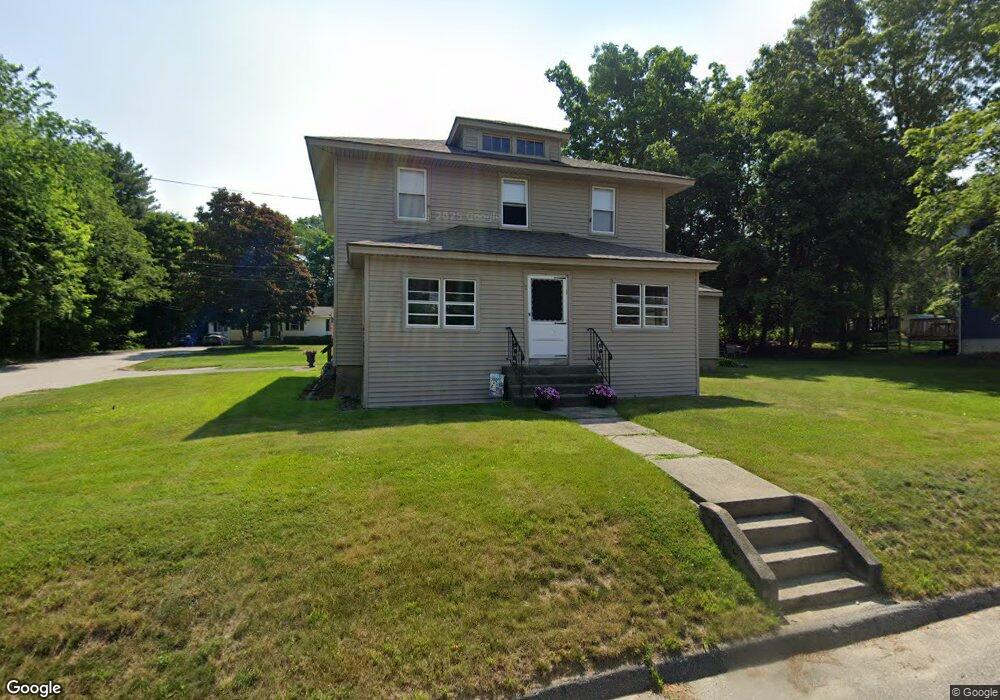
This home is located at 7 Montello St, Worcester, MA 01603 and is currently estimated at $465,473, approximately $242 per square foot. 7 Montello St is a home located in Worcester County with nearby schools including Jacob Hiatt Magnet School, Chandler Magnet, and Heard Street Discovery Academy.
Ownership History
We collect this data history from publicly available records. To have your information removed, we recommend requesting removal directly through your county’s website.
Purchase Details
Home Financials for this Owner
Home Financials are based on the most recent Mortgage that was taken out on this home.Purchase Details
Home Financials for this Owner
Home Financials are based on the most recent Mortgage that was taken out on this home.Purchase Details
Home Values in the Area
Average Home Value in this Area
Purchase History
We collect this data history from publicly available records. To have your information removed, we recommend requesting removal directly through your county’s website.
| Date | Buyer | Sale Price | Title Company |
|---|---|---|---|
| $50,000 | None Available | ||
| $219,000 | None Available | ||
| -- | -- |
Mortgage History
We collect this data history from publicly available records. To have your information removed, we recommend requesting removal directly through your county’s website.
| Date | Status | Borrower | Loan Amount |
|---|---|---|---|
| Open | $315,000 | ||
| Previous Owner | $175,000 | ||
| Closed | $20,000 |
Tax History
We collect this data history from publicly available records. To have your information removed, we recommend requesting removal directly through your county’s website.
| Year | Tax Paid | Tax Assessment Tax Assessment Total Assessment is a certain percentage of the fair market value that is determined by local assessors to be the total taxable value of land and additions on the property. | Land | Improvement |
|---|---|---|---|---|
| 2025 | $5,470 | $414,700 | $99,000 | $315,700 |
| 2024 | $5,339 | $388,300 | $99,000 | $289,300 |
| 2023 | $5,147 | $358,900 | $86,100 | $272,800 |
| 2022 | $4,770 | $313,600 | $68,800 | $244,800 |
| 2021 | $4,659 | $286,200 | $55,100 | $231,100 |
| 2020 | $4,495 | $264,400 | $54,600 | $209,800 |
| 2019 | $4,313 | $239,600 | $47,900 | $191,700 |
| 2018 | $4,279 | $226,300 | $47,900 | $178,400 |
| 2017 | $4,103 | $213,500 | $47,900 | $165,600 |
| 2016 | $4,130 | $200,400 | $35,100 | $165,300 |
| 2015 | $4,022 | $200,400 | $35,100 | $165,300 |
| 2014 | $3,916 | $200,400 | $35,100 | $165,300 |
Map
- 36 Laurier St
- 1 Eames Ave
- 20 Pinehurst Ave
- 25 Marilyn Dr
- 99 Clover St
- 39 Pinehurst Ave
- 23 Cowden St
- 43 Chestnut Ave
- 65 Clover St
- 11 Hulbert Rd Unit 15
- 4 Commonwealth Ave
- 181 Boyce St
- 27 Lavallee Terrace
- 32 Falcon St
- 6 Oakwood Ave
- 25 Vinal St Unit 28
- 25 Vinal St Unit 26
- 71 Henshaw St
- 328 Stafford St
- 3 Magna Vista Dr
Ask me questions while you tour the home.